| 本シリーズのトップページ |
|---|
| https://qiita.com/items/dfb16ffcbbe7745e765e |
概要
変則的だが、職場の "非K8s環境" で Prometheus を導入することになったので
調査・導入検討をしてみた.
なお、職場の "非K8s環境" ではすでに「Zabbix 4.0」を導入しているが、
将来に備えて Prometheus を使ってみたいらしい.
そこで、オンプレ環境で、docker-compose を用いて Prometheus サーバを立てたので、
手順を書き残しておく.
また、Zabbix ユーザ視点でのコメントも少し書き添えておく.
環境
ホスト(物理PC)
DISTRIB_ID=Ubuntu
DISTRIB_RELEASE=18.04
DISTRIB_CODENAME=bionic
DISTRIB_DESCRIPTION="Ubuntu 18.04.4 LTS"
$ hostname -I
192.168.10.47
構築する環境
| 項目 | 値 | 備考 |
|---|---|---|
| Prometheus | version 2.30.3 | 他者の環境では起動エラーになるといったトラブルを避けたいので、バージョン指定している |
| Grafana | 8.2.0-ubuntu | 同上 |
手順
1. ファイル構成
ファイル構成は次の通り.
$ tree . --charset=C --dirsfirst
.
|-- PV
|   |-- etc
|   |   `-- prometheus
|   |       `-- prometheus.yml ..... 後述
|   `-- var
|       `-- lib
|           `-- grafana ............ 現時点では空っぽのディレクトリである
`-- docker-compose.yml
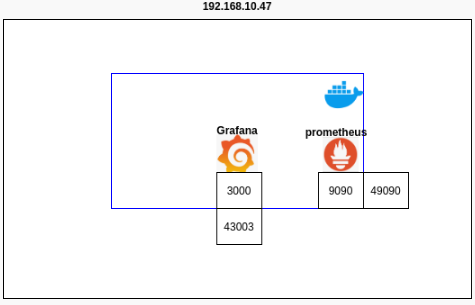
2. docker-compose.yml を作成する
公式手順にある Dockerfile を基にして、docker-compose.yml を作成する.
9090番は「Cockpit (Linux サーバ管理ツール)」と衝突するらしいので、
ここでは 49090 に変更した.1
また、3000番も Rails などと衝突する恐れがあるので、43003番に変更している.
なお、9090番ポートは Zabbix における 10051番ポートに該当する.
(サーバ側が LISTEN するポートである)
version: '3.7'

services:
  prometheus:
    image: prom/prometheus:v2.30.3
    container_name: myprometheus_v2_30_3
    logging:
      driver: "json-file"
      options:
        max-size: "10m"
        max-file: "7"
    ports:
      - 49090:9090
    volumes:
      - ./PV/etc/prometheus/:/etc/prometheus/
  grafana:
    image: grafana/grafana:8.2.0-ubuntu
    container_name: mygrafana_v8_2_0
    ports:
      - '43003:3000'
    user: 'root'
    logging:
      driver: "json-file"
      options:
        max-size: "10m"
        max-file: "7"
    volumes:
      - './PV/var/lib/grafana:/var/lib/grafana'
2. Prometheus 設定ファイルを作成する
Zabbix での /etc/zabbix/zabbix_server.conf に該当するファイル.
下記の 物理ホストのIPアドレス 192.168.10.47 は適宜読み替えること.
PV/etc/prometheus/prometheus.yml
global:
  # How frequently to scrape targets by default.
  scrape_interval: 15s
  # How frequently to evaluate rules.
  evaluation_interval: 15s

# A list of scrape configurations.
scrape_configs:
  - job_name: 'prometheus'
    static_configs:
    - targets: ['192.168.10.47:49090'] #🛑適宜読み替えること.
3. コンテナを稼働させる
3-1. 稼働させる
Zabbix とは異なり、別途 Database を導入する必要が無い.
また Zabbix で実施している PHP のセットアップも不要である.
インストールという面では Prometheus の方が断然楽である.
$ docker-compose up -d
3-2. 稼働確認をする
CLI での確認
$ docker-compose ps
        Name                      Command               State            Ports
---------------------------------------------------------------------------------------
mygrafana_v8_2_0       /run.sh                          Up      0.0.0.0:43003->3000/tcp
myprometheus_v2_30_3   /bin/prometheus --config.f ...   Up      0.0.0.0:49090->9090/tcp
WEB-UI での確認
・http://:49090/ にアクセスして Prometheus の UI が表示されていることを確認する.
・http://:43003 にアクセスして Grafana の UI が表示されていることを確認する.
4. Grafana と Prometheus を連携させる
4-1. Grafana WEB-UI にログインする
ここでは http://<IP>:43003 である.
初回ログインID・PW は「admin」「admin」である.
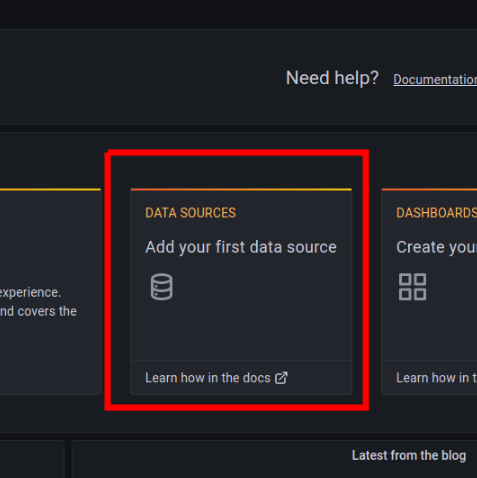
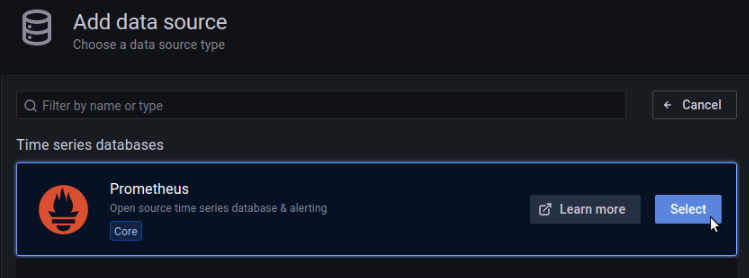
4-2. Prometheus を登録する
4-2-1. 「DATA SOURCES」から Prometheus を選択する
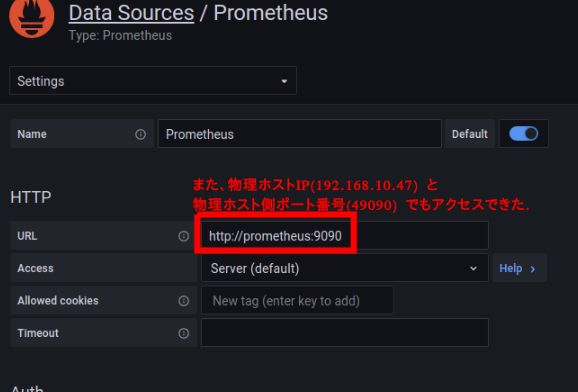
4-2-2. Prometheus を稼働させているマシンの IP と ポートを設定する
画面下部にある「Save & test」を実行して「Datasource updated」が表示されれば良い
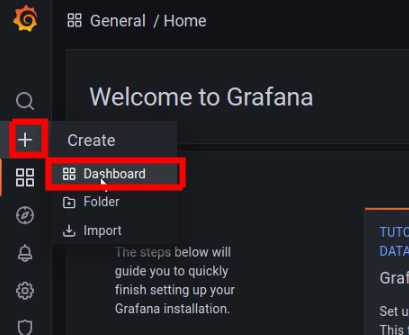
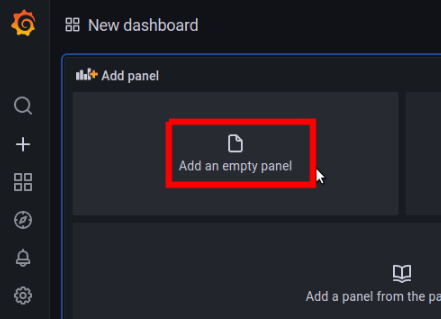
5. Grafana Dashboard に監視項目を登録してみる
Prometheus サーバに対するリクエスト回数を表示する次のクエリを適用する.
「prometheus_http_requests_total」
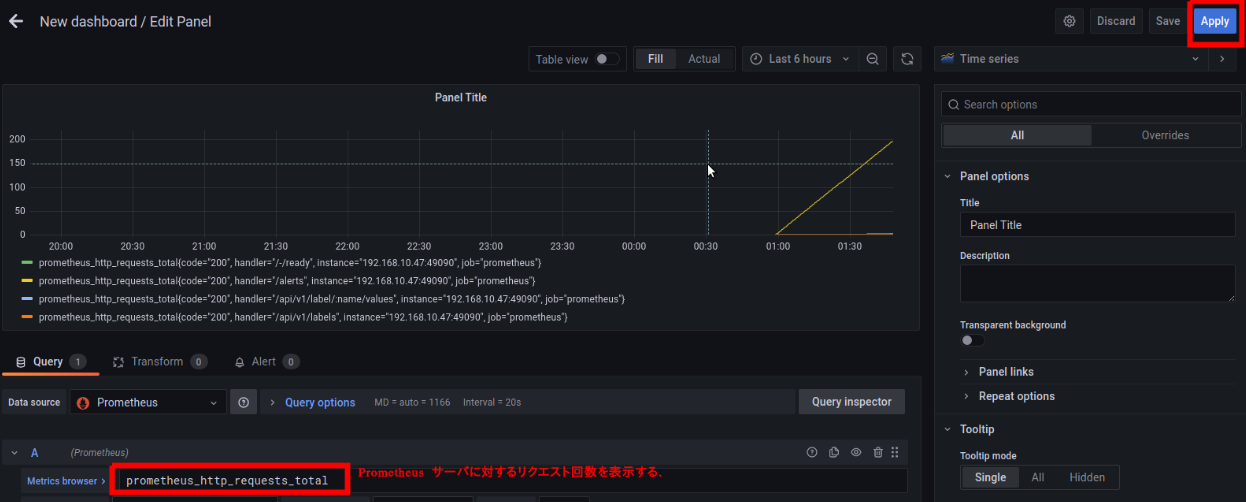
もしも描画に失敗する場合は、ホストの時刻ズレの疑いもあります.
当方は下記で chrony を導入することで解決しました
https://qiita.com/robozushi10/items/e0fde644a47b08e5c534
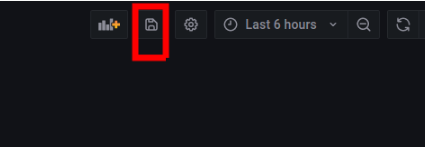
表示内容が問題無ければ、保存する.
6. 稼働後のファイル構成
$ tree . --charset=C --dirsfirst
.
|-- PV
|   |-- etc
|   |   `-- prometheus
|   |       `-- prometheus.yml
|   `-- var
|       `-- lib
|           `-- grafana
|               |-- csv [error opening dir]
|               |-- plugins
|               |-- png [error opening dir]
|               `-- grafana.db
`-- docker-compose.yml
以上.
参考にした情報
・『[改訂3版] Zabbix統合監視実践入門 (技術評論社)』
・https://kazuhira-r.hatenablog.com/entry/2019/04/29/025816
・Prometheus 公式
・CentOS 8 実践ガイド[サーバ構築編]
・Kubernetes実践ガイド クラウドネイティブアプリケーションを支える技術
・PrometheusでKubernetesを監視する本 (電子版)