初期値鋭敏性について紹介したいと思います。
非線形の数理モデルであるロジスティック写像を対象として、初期値鋭敏性を確認します。
ロジスティック写像については、ロジスティック写像の紹介に掲載しています
ロジスティック写像は以下の漸化式のような形で表されます。
$x_{n+1} = a x_{n}(1-x_{n})$
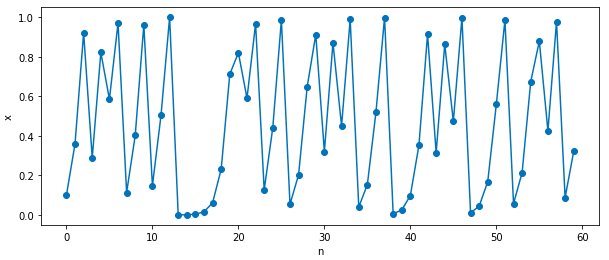
漸化式の形で書けますが、カオスと呼ばれる不規則な動き(以下の図)をします。

では本題の初期値鋭敏性の話に入っていきます。
初期値鋭敏性とは、カオスの定義あるいは特性の一つになります[1]。
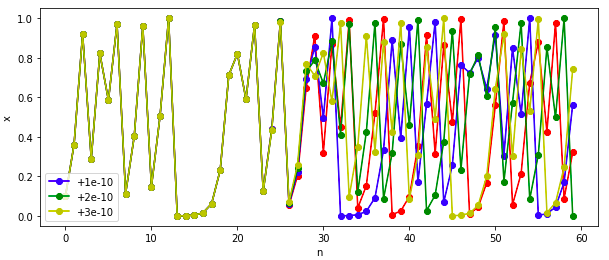
初期値鋭敏性を実際に見てもらうために、初期値$x_{0}=0.1$に微小の誤差を与えます。具体的には誤差を$10^{-10}$とします。
赤色:初期値$x_{0}=0.1$
青色:初期値$x_{0}=0.1+10^{-10}$
緑色:初期値$x_{0}=0.1+2\times10^{-10}$
黄色:初期値$x_{0}=0.1+3\times10^{-10}$
$10^{-10}$という僅かな差ですが、途中から軌道が大きくずれます。これが初期値鋭敏性になります。
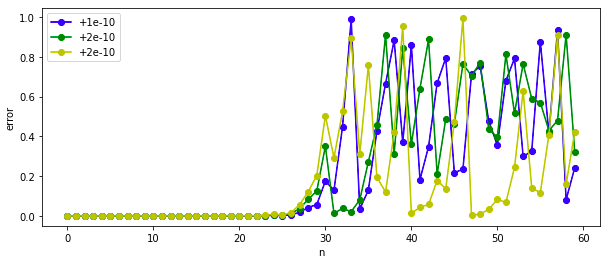
違った視点で、確認するために、誤差の変化を可視化します。

n=20くらいまでは、誤差はかなり小さいですが、n=25くらいから誤差が大きくなり、n=30の時には誤差がかなり大きくなっていることがわかります。
以下、今回使用したコードです。
コードの書き方が微妙ですが、ご了承ください🙏
# ロジスティック写像のデータを生成する関数
def logistic(n,x_0,a):

    # 値を格納する
    x = np.zeros(n)

    # 初期値を設定
    x[0] = x_0

    for i in range(n-1):
        x[i+1] = a*x[i]*(1-x[i])

    return x
# 2つ目の図
gosa = 1e-10
init_bf = 0.1
init_af1 = init_bf+gosa
init_af2 = init_bf+(gosa*2)
init_af3 = init_bf+(gosa*3)

fig = plt.figure(figsize=(10, 4))
plt.rcParams['font.size'] = 10
plt.plot(logistic_v2(60,init_bf,4),marker = "o",color="r")
plt.plot(logistic_v2(60,init_af1,4),marker = "o",color="b",label="+1e-10")
plt.plot(logistic_v2(60,init_af2,4),marker = "o",color="g",label="+2e-10")
plt.plot(logistic_v2(60,init_af3,4),marker = "o",color="y",label="+3e-10")
plt.xlabel("n")
plt.ylabel("x")
plt.legend(loc="best")
plt.show()
# 3つ目の図
length = 60
error_list1 = []
error_list2 = []
error_list3 = []
for i in range(length):
    error_1 = \
    abs(logistic_v2(length,init_bf,4)[i]-logistic_v2(length,init_af1,4)[i])

    error_2 = \
    abs(logistic_v2(length,init_bf,4)[i]-logistic_v2(length,init_af2,4)[i])

    error_3 = \
    abs(logistic_v2(length,init_bf,4)[i]-logistic_v2(length,init_af3,4)[i])

    error_list1.append(error_1)
    error_list2.append(error_2)
    error_list3.append(error_3)

fig = plt.figure(figsize=(10, 4))
plt.rcParams['font.size'] = 10
plt.plot(error_list1,marker = "o",color="b",label="+1e-10")
plt.plot(error_list2,marker = "o",color="g",label="+2e-10")
plt.plot(error_list3,marker = "o",color="y",label="+2e-10")
plt.xlabel("n")
plt.ylabel("error")
plt.legend(loc="best")
引用文献
[1]:https://ja.wikipedia.org/wiki/カオス理論
