今回は、非線形の数理モデルであるロジスティック写像について紹介します。
続編:初期値鋭敏性について(ロジスティック写像)
ロジスティック写像は以下の漸化式のような形で表されます。
$x_{n+1} = a x_{n}(1-x_{n})$
ロジスティック写像は、「低次元離散力学系」です。
また、実装が簡単かつカオスと呼ばれる現象を確認できるので、個人的に好きな数理モデルです。
実際に実装していきます。ここではlogisticという関数を定義します。
生成したいデータ数(時系列)を$n$, 初期値を$x_0$, ロジスティック写像のパラメータ$a$の3つを引数としています。
戻り値は、ロジスティック写像のデータ(時系列)が入った配列です。
import numpy as np
import matplotlib.pyplot as plt

def logistic(n,x_0,a):

    # 値を格納する
    x = np.zeros(n)

    # 初期値を設定
    x[0] = x_0

    for i in range(n-1):
        x[i+1] = a*x[i]*(1-x[i])

    return x
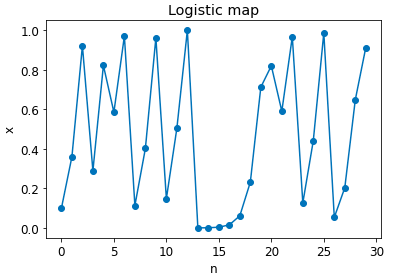
実際に$a=4$の場合のロジスティック写像を確認してみます。
# n=30, x_0=0.1, a=4 の時
x = logistic(30, 0.1, 4) #ロジスティック写像のデータを生成
plt.plot(x,marker="o") #プロット
plt.title("Logistic map") #タイトル付け
plt.xlabel("n") #x軸のラベルを指定
plt.ylabel("x") #y軸のラベルを指定
plt.show()
結果は以下のようになります。不規則な動きをしているのが確認できます。

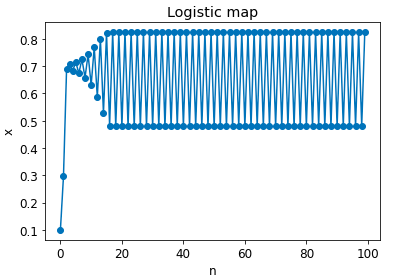
ここで、パラメータ$a=3.3$に変更してロジスティック写像の動きを確認したいと思います。

$a=4$の時は非周期な動きをしていましたが、$a=3.3$は、途中から周期的な動きをしていることがわかります。
今回は$a$の値を変えましたが、初期値の値を変えることでまた違った動きが確認できます。色々試してみてください。
(*)ちなみに初期値$x_{0}=0$の時は、パラメータ$a$をどんな値にしても$x_{n}=0$になります。
次回は、カオス力学系の特徴の一つである"初期値鋭敏性"について紹介したいと思います。
続編:初期値鋭敏性について(ロジスティック写像)