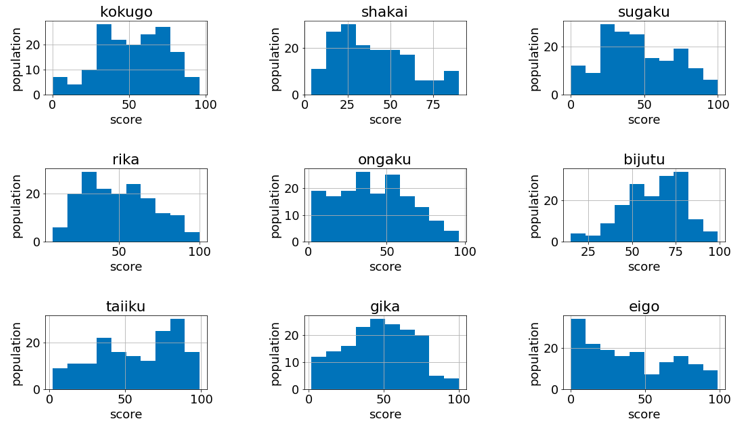
複数のグラフを一度にプロットするコードを記載する。
用いたデータは統計科学研究所にある成績に関するデータセットを用いている。
統計科学研究所: https://statistics.co.jp/reference/statistical_data/statistical_data.htm
### 必要なライブラリ・モジュールをインポートする
import numpy as np
import pandas as pd
import matplotlib.pyplot as plt
import gc
import matplotlib.gridspec as gridspec

### 成績データを読み込む
seiseki = pd.read_csv("seiseki.csv")
今回は、各科目のヒストグラムを可視化する。
### 国語のヒストグラムを表示
seiseki["kokugo"].hist()
次に9科目を一度に表示する
### グラフのサイズやフォントのサイズの設定
plt.rcParams["font.size"] = 18
fig = plt.figure(figsize=(18, 10))
gs = gridspec.GridSpec(3, 3, wspace=0.6, hspace=1)

### 科目数だけグラフを表示したいので、科目の数だけループする。
### len(seiseki.columns):科目数
for i in range(len(seiseki.columns)):
    gs_0 = i%3
    gs_1 = i//3

    ### ヒストグラムを表示
    ### seiseki.columns[1]:shakai
    ### seiseki.columns[3]:rika
    ax = plt.subplot(gs[gs_1, gs_0])
    seiseki[seiseki.columns[i]].hist()

    ### 以下はタイトル付けやラベル付け
    plt.title(seiseki.columns[i])
    plt.xlabel("score")
    plt.ylabel("population")
結果は以下のように表示されます。

今回紹介したコードはあくまで一例であり、より良い書き方があると思います。
参考になれば幸いです。