1. Visual Studio と VS Code の違い
-
Visual Studio (VS)
→ Microsoft製の統合開発環境 (IDE)。C/C++/C#/Python などをまとめて開発可能。GUI設計や大規模開発に向く。 -
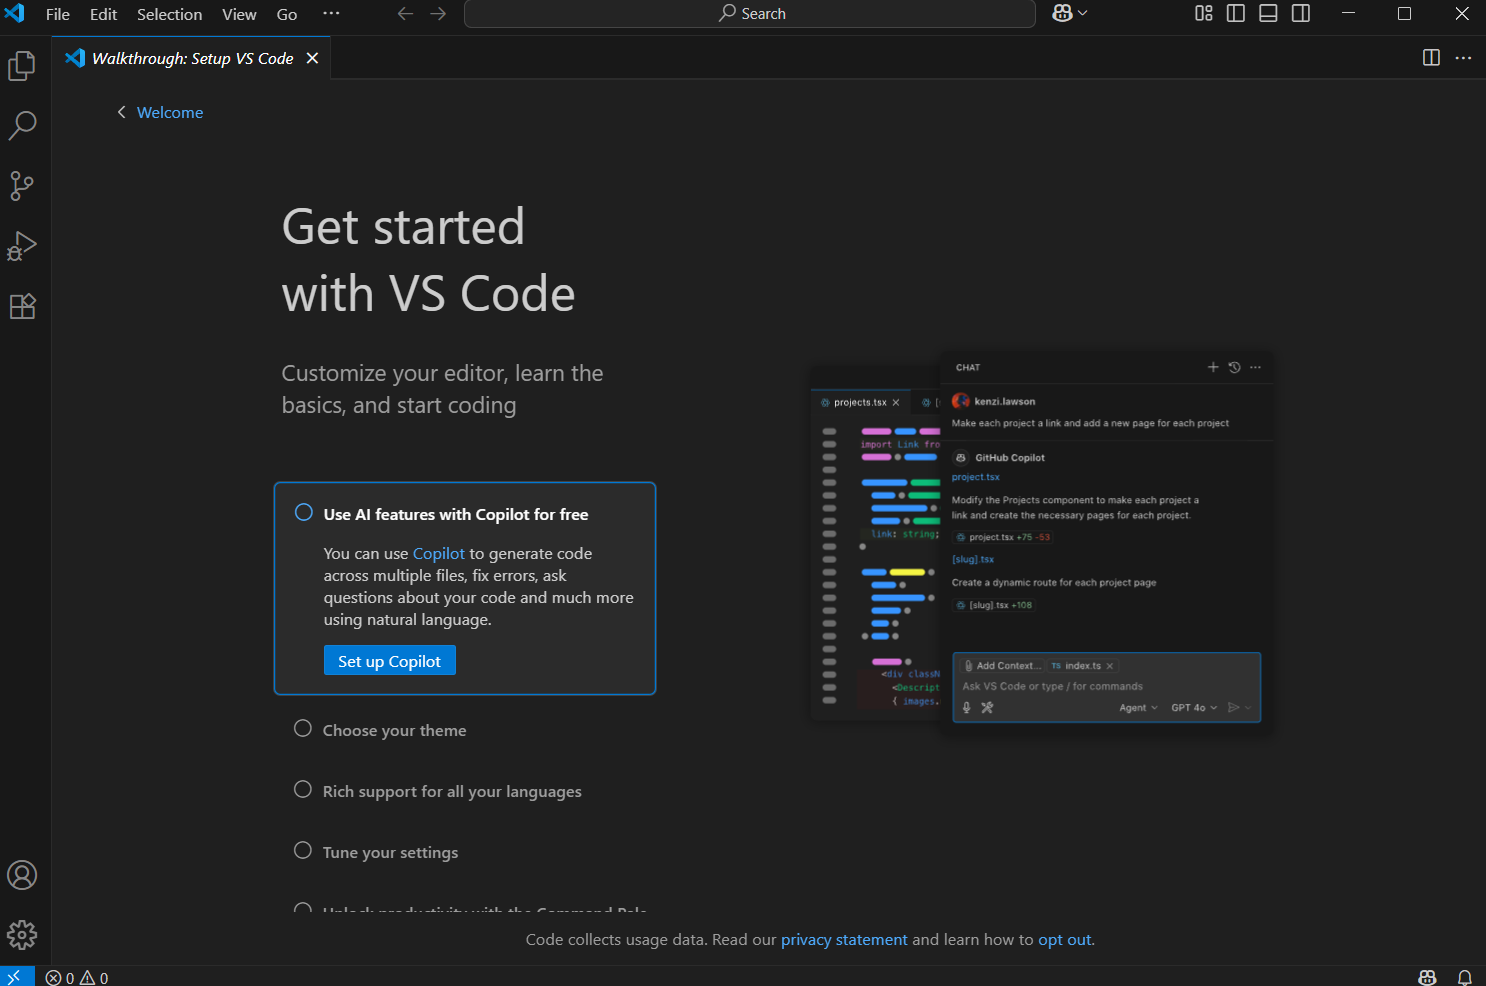
Visual Studio Code (VS Code)
→ 軽量エディタ+拡張機能で Python を快適に使える。学生〜研究開発で人気。
👉 Pythonを使うだけなら VS Code がオススメ。
👉 もし「Visual Studio本体」でやりたいなら Python開発ワークロード を追加する必要があります。
2. Python 環境構築(Visual Studio 本体)
-
Visual Studio インストーラを起動
- Microsoft公式 からインストーラを入手
- 既にインストール済みなら「変更」で機能追加
-
ワークロードの選択
- 「Python 開発」チェックをON
- これで Python本体 + 必要なツールがインストールされる
-
環境確認
-
Visual Studio 起動 → 新しいプロジェクト → 「Python アプリケーション」
-
コード例:
print("Hello, Visual Studio with Python!")
-
3. Python 環境構築(VS Code)
-
VS Code をインストール
-
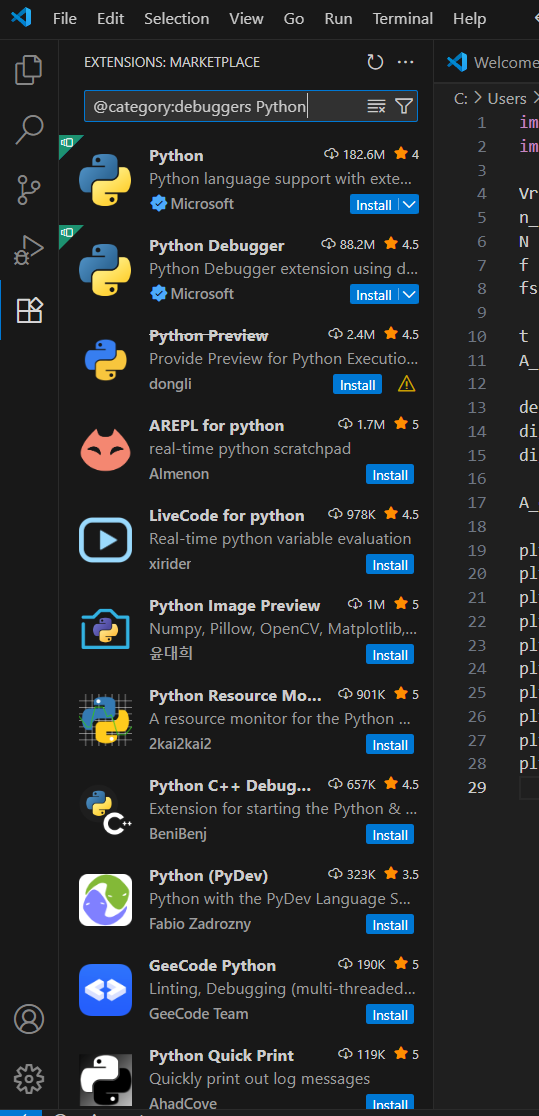
拡張機能 → Python をインストール
- Microsoft公式の拡張(IntelliSense, デバッグ, 仮想環境対応)
-
Python 本体の導入
- Python.org または Anaconda をインストール
-
仮想環境の推奨
python -m venv .venv .venv\Scripts\activate # Windows -
コード実行
-
F5 でデバッグ実行
-
例:
import numpy as np

x = np.linspace(0, 2*np.pi, 100)
y = np.sin(x)

print("sin wave first 5 samples:", y[:5])
-
4. よく使うライブラリ
pip install numpy matplotlib pandas scipy scikit-learn jupyter
- numpy → 数値計算
- matplotlib → グラフ表示
- pandas → データ分析
- scipy → 科学技術計算
- scikit-learn → 機械学習
- jupyter → ノートブック環境
5. 工学・教育向けのTips
- Visual Studio Code + Jupyter拡張 → Pythonで計算+グラフが簡単に試せる
- Visual Studio本体 → 研究用GUIアプリやC++/Python混在プロジェクトを作りたいとき便利
✅ 実行できないときの確認リスト
1. Pythonがインストールされているか?
ターミナルを開いて次を入力:
python --version
または
py --version
→ Python 3.x.x と表示されればOK。
なければ Python公式サイト からインストールしてください。
2. VS Code に Python 拡張が入っているか?
左の「拡張機能」タブで Python (Microsoft製) をインストール。
これがないと、plt.show() が走らないことがあります。
3. Python インタープリタを選択したか?
右下や左上に「Select Interpreter」と出るはずです。
ショートカット:
Ctrl + Shift + P → "Python: Select Interpreter"
そこでインストール済みの Python を選択。
4. 実行方法
エディタ上部の ▶(Run Python File)を押すか、
ターミナルから直接:
python adc_dac_sine_plot.py
5. 必要ライブラリをインストールしたか?
次をターミナルで入力:
pip install numpy matplotlib
これでエラー ModuleNotFoundError が消えます。
🚀 最小確認コード
試しに以下を作って実行してみてください。
import matplotlib.pyplot as plt
import numpy as np

t = np.linspace(0, 1, 500)
y = np.sin(2*np.pi*5*t)

plt.plot(t, y)
plt.title("Test sine wave")
plt.show()