continuation from Fundamental Statistics for Data Science (Part 01).
5) Mean
Mean is also famous as average in mathematics, which can be obtained by summing all the observations and divided by the number of data points.
Let us think that a random variable has the following data. N is the number of data points.
X = { x1, x2, x3, . . . , xN }
We can calculate the mean using the following equation.

import numpy as np

x = np.array([1,2,3,4,5,6])
x_mean = np.mean(x)

print(x_mean)
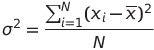
6) Variance
Variance refers to a spread between numbers in a data set. More pointedly, variance measures how far each number in the set is from the mean value in the dataset. When we calculated the sample variance, we can use it to approximate the population variance.
import numpy as np
x = np.array([1,4,3,6])
x_variance = np.var(x)

print(x_variance)
7) Standard Deviation
Standard deviation measures the distribution of a dataset relative to its mean.
We can calculate it by the square root of the variance.
Standard deviation is usually favored over the variance since it has the same unit as the data points, implying we can interpret it more easily.
import numpy as np
x = np.array([1,4,3,6])
x_std = np.std(x)

print(x_std)
Let's continue from part 03
*本記事は @qualitia_cdevの中の一人、@nuwanさんが書いてくれました。
*This article is written by @nuwan a member of @qualitia_cdev.