This article series will present some of the statistical concepts you need to learn when paddling down the data science exploration.
While you are beginning your data science or analytics journey, having statistical awareness will assist you in leveraging data insights. We cannot underrate the significance of statistics in data science and data analytics.
Acknowledging the fundamentals of statistics will empower you to think better and be creative when utilizing the data to solve issues.
1) Population and Sample
In statistics, populations mean the set of all the observations. It is usually very large. Moreover, a sample is a subset of observation from the population, ideally true population representation.
Researching with an entire population is impossible most of the time. So researchers use subset (sample) rather than the entire populations for an experiment. For accurate results, the sample should represent the population, which is termed an unbiased subset. There are several sampling methods for getting samples from populations.
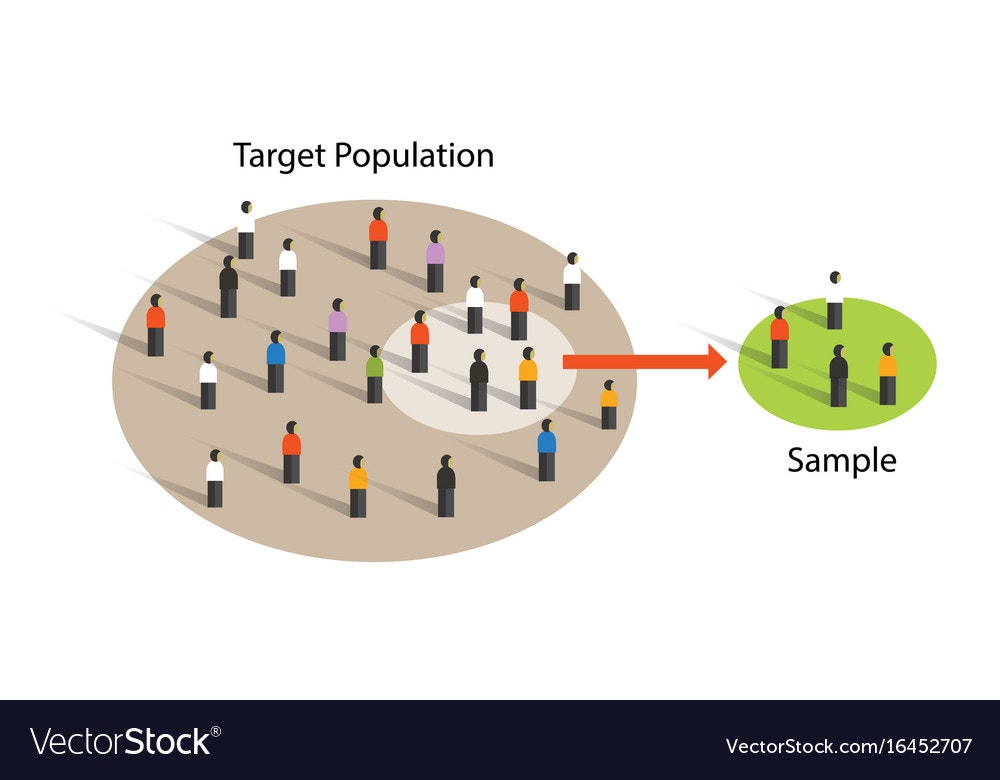
Image Source: https://www.vectorstock.com/royalty-free-vector/sample-from-population-statistics-research-survey-vector-16452707
2) Random Variable
In mathematics, we used variables. However, here it is a bit different. So forget about the mathematical definition. A random variable is used to save the outcomes of a random process. For example, when flipping a coin, random variable X can be head(1) or tail (0). When throwing a dice, random variable X can be 1,2,3,4,5,6.
3) Sample Space
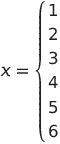
Think about throwing dice, and it can give six possible outcomes. Values can be 1,2,3,4,5, or 6. {1,2,3,4,5,6} this set of all possible outcomes defined as sample space of a experiment.
4) Probability
Chance (Likelihood) of getting a particular outcome of an event is defined as probability. Let us think about the same example above, throwing a dice. So we know that X={1, 2, 3, 4, 5, 6}. So the sample size is six.
Likelihood (probability) of getting 4 when can be written as;
P(X = 4) = 1/6
Similarly, probability of getting an even number can be written as;
P(X = even number) = 0.5
It is important to note that, for an event probability range should be within [0,1]
Let's continue from part 02
*本記事は @qualitia_cdevの中の一人、@nuwanさんが書いてくれました。
*This article is written by @nuwan a member of @qualitia_cdev.