はじめに
川の氾濫状況をAIがモニタリングして、溢れてたら降りたり近づいたりしないように
警告できないか考えてみた。
モチベーション:
(コロナで暇だった・・・訳ではない。まずなんでも良いから、qiita初投稿してみたかった。)
2020年7月は過去最長の梅雨でした。
30年見てきている、京都の賀茂川も雨の度に氾濫気味で、市の方が川辺へ降りないように柵まで用意してくれたけど、電子掲示板で逐一状況を表示してくれたらみんなハッピーかなと思った。
(防災カメラはあるはずで、もうやってたらごめんなさい。水位がわかると思うのでAIとの合わせ技が良いかも)
京都市防災カメラのURLはこちら


先に結論
画像を集めるのが大変で、途中で結果が出ないことに気がついた。
補足
機械学習ををこれからはじめようとする方々にも使えるように
簡単な3値分類のフレームワークを使いましたので、結果よりも、コードを
参考にしていただければ幸いです。
文章やコードなどの書き方、見せ方はこれから勉強していきます。
下手くそなので、あらかじめご了承ください。
実装について
Kerasを使った3値分類にしました。
あんまり深く考えすぎず、信号みたいに
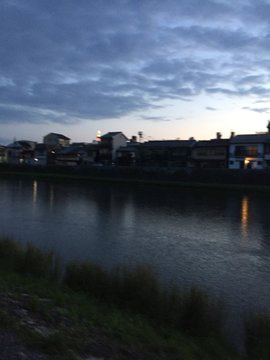
・安全な状況(青色)
・注意が必要な状態(黄色)
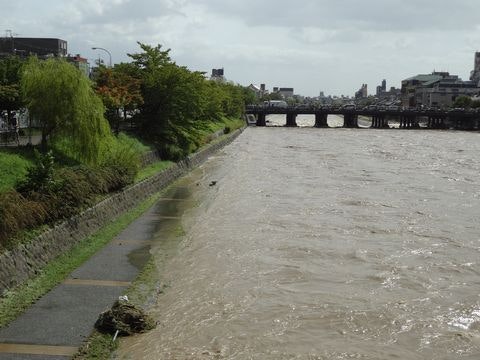
・危険な状態(赤色)
がでたらそれで十分かと思いました。
・安全な状況(青色)
・注意が必要な状態(黄色)
↑はこちらから転載させていただいております。
・危険な状態(赤色)

コード
コードは以下のgitに挙げています。
コード参照元
kaggleのAPTOSコンペのコードをベースに作成しました。
https://www.kaggle.com/c/aptos2019-blindness-detection/notebooks?sortBy=voteCount&group=everyone&pageSize=20&competitionId=14774
中身の学習用データは全てtwitterなどSNSに落ちている画像を使用させていただきました、
表示するのは引用元がないのは自分で撮影した画像です。
実装
必要なライブラリを読み込みます
import json
import math
import os

import cv2
from PIL import Image
import numpy as np
from keras import layers
from keras.applications import DenseNet121
from keras.callbacks import Callback, ModelCheckpoint
from keras.preprocessing.image import ImageDataGenerator
from keras.models import Sequential
from keras.optimizers import Adam
import matplotlib.pyplot as plt
import pandas as pd
from sklearn.model_selection import train_test_split
from sklearn.metrics import cohen_kappa_score, accuracy_score
import scipy
import tensorflow as tf
from tqdm import tqdm
import glob

%matplotlib inline
データの読み込み
今回は3つのデータフォルダに入れて読み込みに行っています。
# 安全な状況(青色)
files=glob.glob("./images/ok/*")
dfok=pd.DataFrame(files,columns=["id_code"])
dfok["diagnosis"]=0
dfok.shape
# 注意が必要な状態(黄色)
files=glob.glob("./images/bad/*")
dfbad=pd.DataFrame(files,columns=["id_code"])
dfbad["diagnosis"]=1
dfbad.shape
# 危険な状態(赤色)
files=glob.glob("./images/ng/*")
dfng=pd.DataFrame(files,columns=["id_code"])
dfng["diagnosis"]=2
dfng.shape
dfall=pd.concat([dfok,dfbad,dfng])
dfall.shape
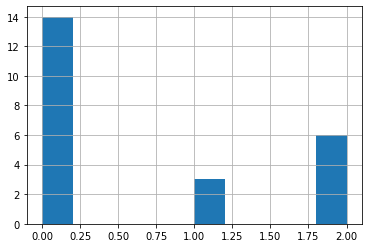
dfall['diagnosis'].hist()
dfall['diagnosis'].value_counts()
dfall.shape
データの分割とサイズのリサイズなど
スペックの問題で画像サイズは32にしていますが、GPU使えるなら256*256のほうがいいです。
from sklearn.model_selection import train_test_split

train_df, test_df=train_test_split(dfall,test_size=0.20)
train_df.shape

def get_pad_width(im, new_shape, is_rgb=True):
    pad_diff = new_shape - im.shape[0], new_shape - im.shape[1]
    t, b = math.floor(pad_diff[0]/2), math.ceil(pad_diff[0]/2)
    l, r = math.floor(pad_diff[1]/2), math.ceil(pad_diff[1]/2)
    if is_rgb:
        pad_width = ((t,b), (l,r), (0, 0))
    else:
        pad_width = ((t,b), (l,r))
    return pad_width

def preprocess_image(image_path, desired_size=32):
    im = Image.open(image_path)
    im = im.resize((desired_size, )*2, resample=Image.LANCZOS)

    return im
N = train_df.shape[0]
x_train = np.empty((N, 32, 32, 3), dtype=np.uint8)
for i, image_id in enumerate(tqdm(train_df['id_code'])):
x_train[i, :, :, :] = preprocess_image(image_id)
x_train.shape
N = test_df.shape[0]
x_test = np.empty((N, 32, 32, 3), dtype=np.uint8)
for i, image_id in enumerate(tqdm(test_df['id_code'])):
x_test[i, :, :, :] = preprocess_image(image_id)
y_train = pd.get_dummies(train_df['diagnosis']).values
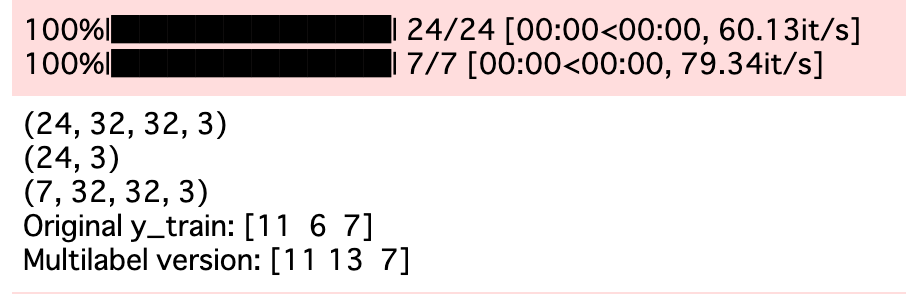
print(x_train.shape)
print(y_train.shape)
print(x_test.shape)
y_train_multi = np.empty(y_train.shape, dtype=y_train.dtype)
y_train_multi[:, 2] = y_train[:, 2]
for i in range(2):
y_train_multi[:, i] = np.logical_or(y_train[:, i], y_train_multi[:, i+1])
print("Original y_train:", y_train.sum(axis=0))
print("Multilabel version:", y_train_multi.sum(axis=0))
x_train, x_val, y_train, y_val = train_test_split(
x_train, y_train_multi,
test_size=0.15,
random_state=2019
)
それぞれのクラスのデータ数を確認します。
クラスの定義
class MixupGenerator():
    def __init__(self, X_train, y_train, batch_size=32, alpha=0.2, shuffle=True, datagen=None):
        self.X_train = X_train
        self.y_train = y_train
        self.batch_size = batch_size
        self.alpha = alpha
        self.shuffle = shuffle
        self.sample_num = len(X_train)
        self.datagen = datagen

    def __call__(self):
        while True:
            indexes = self.__get_exploration_order()
            itr_num = int(len(indexes) // (self.batch_size * 2))

            for i in range(itr_num):
                batch_ids = indexes[i * self.batch_size * 2:(i + 1) * self.batch_size * 2]
                X, y = self.__data_generation(batch_ids)

                yield X, y

    def __get_exploration_order(self):
        indexes = np.arange(self.sample_num)

        if self.shuffle:
            np.random.shuffle(indexes)

        return indexes

    def __data_generation(self, batch_ids):
        _, h, w, c = self.X_train.shape
        l = np.random.beta(self.alpha, self.alpha, self.batch_size)
        X_l = l.reshape(self.batch_size, 1, 1, 1)
        y_l = l.reshape(self.batch_size, 1)

        X1 = self.X_train[batch_ids[:self.batch_size]]
        X2 = self.X_train[batch_ids[self.batch_size:]]
        X = X1 * X_l + X2 * (1 - X_l)

        if self.datagen:
            for i in range(self.batch_size):
                X[i] = self.datagen.random_transform(X[i])
                X[i] = self.datagen.standardize(X[i])

        if isinstance(self.y_train, list):
            y = []

            for y_train_ in self.y_train:
                y1 = y_train_[batch_ids[:self.batch_size]]
                y2 = y_train_[batch_ids[self.batch_size:]]
                y.append(y1 * y_l + y2 * (1 - y_l))
        else:
            y1 = self.y_train[batch_ids[:self.batch_size]]
            y2 = self.y_train[batch_ids[self.batch_size:]]
            y = y1 * y_l + y2 * (1 - y_l)

        return X, y
データ水増しなど
# バッチサイズ
BATCH_SIZE = 16

def create_datagen():
    return ImageDataGenerator(
        zoom_range=0.15,  # set range for random zoom
        # set mode for filling points outside the input boundaries
        fill_mode='constant',
        cval=0.,  # value used for fill_mode = "constant"
        horizontal_flip=True,  # randomly flip images
        vertical_flip=True,  # randomly flip images
    )

# Using original generator
data_generator = create_datagen().flow(x_train, y_train, batch_size=BATCH_SIZE, seed=2019)
# Using Mixup
mixup_generator = MixupGenerator(x_train, y_train, batch_size=BATCH_SIZE, alpha=0.2, datagen=create_datagen())()

class Metrics(Callback):
    def on_train_begin(self, logs={}):
        self.val_kappas = []

    def on_epoch_end(self, epoch, logs={}):
        X_val, y_val = self.validation_data[:2]
        y_val = y_val.sum(axis=1) - 1

        y_pred = self.model.predict(X_val) > 0.5
        y_pred = y_pred.astype(int).sum(axis=1) - 1

        _val_kappa = cohen_kappa_score(
            y_val,
            y_pred,
            weights='quadratic'
        )

        self.val_kappas.append(_val_kappa)

        print(f"val_kappa: {_val_kappa:.4f}")

        if _val_kappa == max(self.val_kappas):
            print("Validation Kappa has improved. Saving model.")
            self.model.save('model.h5')

        return

# DenseNetをしよう。ここのモデルを変えると色々なモデルが試せます。
densenet = DenseNet121(
    weights="imagenet",
    include_top=False,
    input_shape=(32,32,3)
)

def build_model():
    model = Sequential()
    model.add(densenet)
    model.add(layers.GlobalAveragePooling2D())
    model.add(layers.Dropout(0.5))
    model.add(layers.Dense(3, activation='sigmoid'))

    model.compile(
        loss='binary_crossentropy',
        optimizer=Adam(lr=0.00005),
        metrics=['accuracy']
    )

    return model
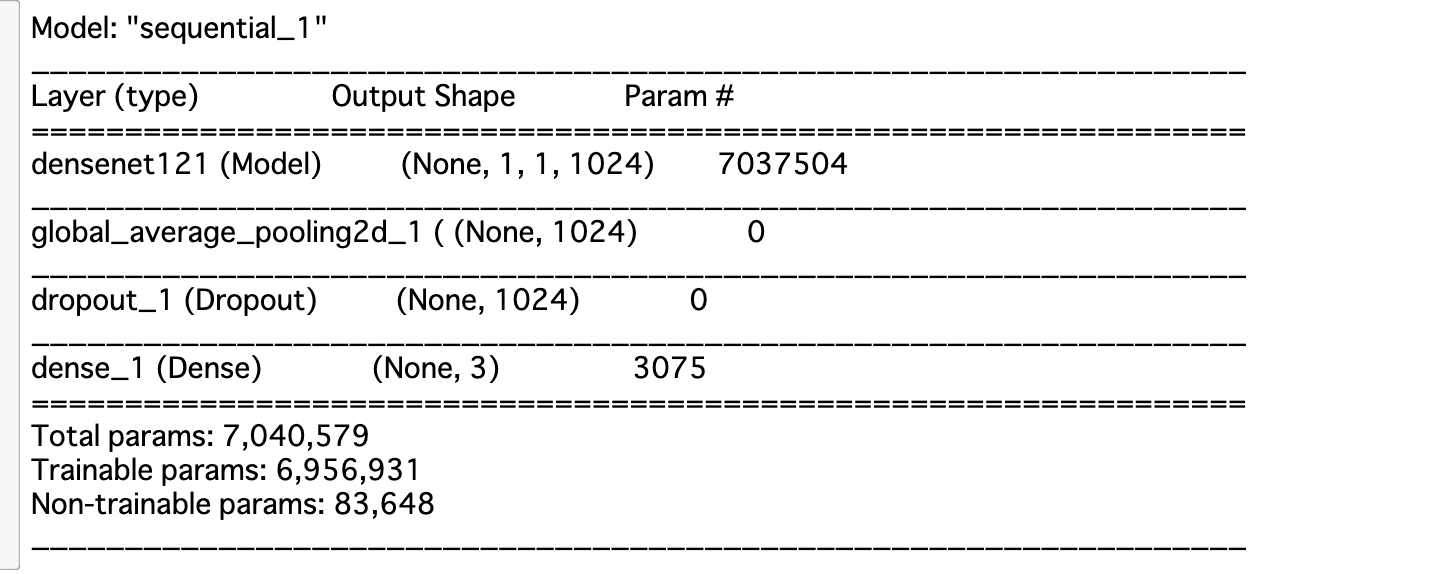
モデルをビルドします
model = build_model()
model.summary()

kappa_metrics = Metrics()
モデルのサマリー
学習します。epockは自由に変えてください
history = model.fit_generator(
    data_generator,
    steps_per_epoch=x_train.shape[0] / BATCH_SIZE,
    epochs=50,
    validation_data=(x_val, y_val),
    callbacks=[kappa_metrics])
推論します
model.load_weights('model.h5')
y_val_pred = model.predict(x_val)
def compute_score_inv(threshold):
    y1 = y_val_pred > threshold
    y1 = y1.astype(int).sum(axis=1) - 1
    y2 = y_val.sum(axis=1) - 1
    score = cohen_kappa_score(y1, y2, weights='quadratic')

    return 1 - score

simplex = scipy.optimize.minimize(
    compute_score_inv, 0.5, method='nelder-mead'
)

best_threshold = simplex['x'][0]

y_test = model.predict(x_test) > 0.5
y_test = y_test.astype(int).sum(axis=1) - 1

test_df['prediction'] = y_test
test_df.to_csv('kamogawa_result.csv',index=False)
推論結果を確認しましょう
test_df
 ↑上記は全然予測できていない結果です。。。
最後の出力部分
prediction=test_df.prediction
id=test_df.id_code
%matplotlib inline
plt.figure(figsize=(16,12))

for num,i  in enumerate(zip(prediction,id)):
    plt.subplot(4,2,num+1)
    if i[0] == 0 :
        print("今日の川の水域は安全です。")
        image=cv2.imread(i[1],1)
        plt.title("safe")
#         plt.title(i[1])
        plt.imshow(image)
    elif i[0] ==1 :
        print("川の水位が上がっていますので十分注意してください。")
        image=cv2.imread(i[1],1)
#         plt.title(i[1])
        plt.title("be careful")
        plt.imshow(image)
    else :
        print("川が氾濫しています。絶対に川辺には降りないでください")
        image=cv2.imread(i[1],1)
#         plt.title(i[1])
        plt.title("Do NOT enter")
        plt.imshow(image)
出力例
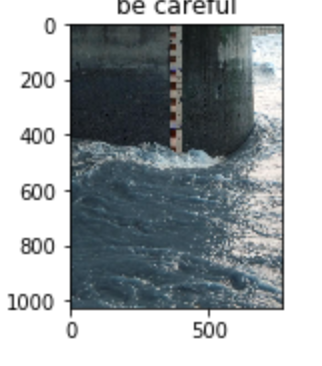
とりあえず出力しました。
感想
安全な状態と、危険な状態はわかりやすいですが注意状態の画像はなかなかなく、
探すのが大変でした、途中で諦めてエイやでやってしまった。
ちゃんとやろうと思ったら、自分で撮った方が早いです。
またGPUを使えず画像サイズを32に落としましたが、224*224で学習すればきちんと推論ができるかもしれません。
川の氾濫は、すでにセンサー等で見ているので、AIは使う必要ないかもですが、
夜間に川の側に人がいないかなどの検知には、役立つかもしれません。
次は物体検知でやってみようかなと思います。
コードの間違いなどありましたら、ご指摘ください。
言い訳
綺麗な画像を十分に集められる人であれば、良い予測値が出ると思います。
もし川の関係者がいれば、やってみてください。
参考URL
コード(再掲)
コードは以下のgitに挙げています。
コードなど、何か質問あればお気軽にご連絡ください
https://github.com/nakamolinto/River_flood_detection
最後に
twitterもやってます。よかったらフォローしてください。
https://twitter.com/pythonmachine