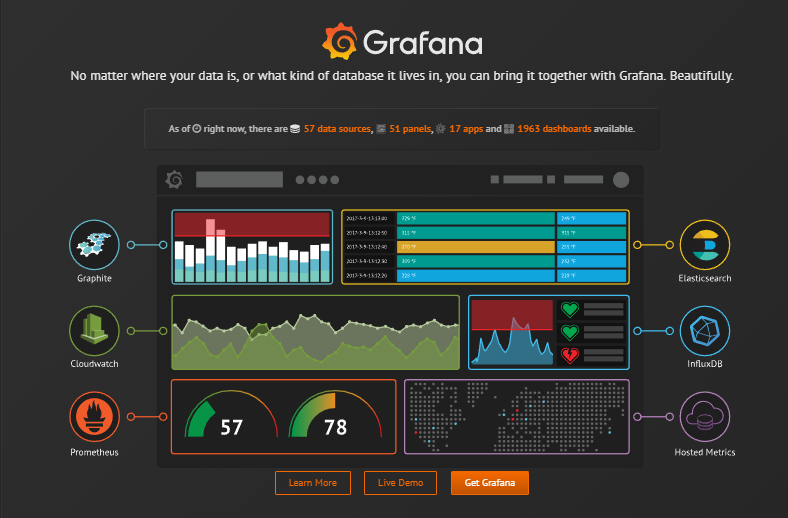
データベースにあるデータをグラフなどで可視化するツールである「Grafana」を使って、AWS CloudWatchのデータを可視化してみたいと思います。
動作が軽快で、画面もカッコよいです。
Grafana
https://grafana.com/
基本機能として、DBに保存しておいたデータをグラフ化するものなのですが、有志によるPluginを追加することで、いろいろなデータを扱えるようになります。例えば、今回取り上げるAWS CloudWatch以外にも、Zabbixサーバとの連携も可能です。また、ゲージやヒートマップ、レーダーチャートなど、多彩な表示もあるので、カッコいいダッシュボードが作れそうです。
本記事の続編はこちら
GrafanaでQiitaのView数を眺める
Grafanaのインストール
WindowsやMacにもインストールできますが、今回はUbuntuにインストールしたので、以下を参考に進めます。
(参考情報) Installing on Debian/Ubuntu
https://grafana.com/docs/installation/debian/
本日時点では、以下が最新でした。
https://dl.grafana.com/oss/release/grafana_6.2.5_amd64.deb
wget https://dl.grafana.com/oss/release/grafana_6.2.5_amd64.deb
sudo apt-get install -y adduser libfontconfig1
sudo dpkg -i grafana_6.2.5_amd64.deb
あとは、以下を実行するだけです。
sudo service grafana-server start
さっそくブラウザから開いてみましょう。
http://【インストール先ホスト名】:3000
ログイン画面が表示されます。
初期のユーザID/パスワードは、admin/adminです。
ちなみに、起動時に自動的に起動させるには、以下を実行しておきます。
sudo update-rc.d grafana-server defaults
CloudWatch Agentも使ってみる
せっかくなので、CloudWatchをGrafanaで参照する前に、他のオンプレのサーバの情報も可視化できるようにしみましょう。それもCloudWatchに集約して、あとでGrafanaでまとめて見れるようにします。
CloudWatch Agentのインストール
以下を参考にしながら進めます。
wget https://s3.amazonaws.com/amazoncloudwatch-agent/ubuntu/amd64/latest/amazon-cloudwatch-agent.deb
sudo dpkg -i -E ./amazon-cloudwatch-agent.deb
エージェント設定ファイルの作成
次に、CloudWatchに集約する情報を指定する設定ファイルを作成します。
以下を参考にしながら進めます。
まずは、AWS管理コンソールから、IAMのページに移動し、CloudWatchを参照するアクセス権を持ったユーザを作成します。ユーザ名は、たとえば、「cwagent」としてみました。
必要なロールは「CloudWatchAgentServerPolicy」です。アクセスの種類は、プログラムによるアクセスだけでよいです。
作成すると、アクセスキーとシークレットキーが生成されたかと思います。それを覚えておきます。
そういえば、AWS-CLIがインストールされている前提です。
まだの場合は、以下を参考にインストールします。
https://docs.aws.amazon.com/ja_jp/cli/latest/userguide/cli-chap-install.html
さきほど作成したcwagentさんのアクセスキーとシークレットキーをaws cliから参照できるように設定します。
> aws configure --profile AmazonCloudWatchAgent
ここで、さきほど生成したアクセスキーとシークレットを指定します。
regionは「ap-northeast-1」にします。output formatは「json」でいいかな。
次に、設定ファイルを生成します。生成にはウィザードを使いました。
# /opt/aws/amazon-cloudwatch-agent/bin/amazon-cloudwatch-agent-config-wizard
=============================================================
= Welcome to the AWS CloudWatch Agent Configuration Manager =
=============================================================
On which OS are you planning to use the agent?
1. linux
2. windows
default choice: [1]:
1
Trying to fetch the default region based on ec2 metadata...
Are you using EC2 or On-Premises hosts?
1. EC2
2. On-Premises
default choice: [2]:
2
Please make sure the credentials and region set correctly on your hosts.
Refer to http://docs.aws.amazon.com/cli/latest/userguide/cli-chap-getting-started.html
Which user are you planning to run the agent?
1. root
2. cwagent
3. others
default choice: [1]:
1
Do you want to turn on StatsD daemon?
1. yes
2. no
default choice: [1]:
1
Which port do you want StatsD daemon to listen to?
default choice: [8125]

What is the collect interval for StatsD daemon?
1. 10s
2. 30s
3. 60s
default choice: [1]:
3
What is the aggregation interval for metrics collected by StatsD daemon?
1. Do not aggregate
2. 10s
3. 30s
4. 60s
default choice: [4]:
4
Do you want to monitor metrics from CollectD?
1. yes
2. no
default choice: [1]:
1
Do you want to monitor any host metrics? e.g. CPU, memory, etc.
1. yes
2. no
default choice: [1]:
1
Do you want to monitor cpu metrics per core? Additional CloudWatch charges may apply.
1. yes
2. no
default choice: [1]:
1
Would you like to collect your metrics at high resolution (sub-minute resolution)? This enables sub-minute resolution for all metrics, but you can customize for specific metrics in the output json file.
1. 1s
2. 10s
3. 30s
4. 60s
default choice: [4]:
4
Which default metrics config do you want?
1. Basic
2. Standard
3. Advanced
4. None
default choice: [1]:
3
Current config as follows:
{
        "agent": {
                "metrics_collection_interval": 60,
                "run_as_user": "root"
        },
★省略★
}
Are you satisfied with the above config? Note: it can be manually customized after the wizard completes to add additional items.
1. yes
2. no
default choice: [1]:
1
Do you have any existing CloudWatch Log Agent (http://docs.aws.amazon.com/AmazonCloudWatch/latest/logs/AgentReference.html) configuration file to import for migration?
1. yes
2. no
default choice: [2]:
2
Do you want to monitor any log files?
1. yes
2. no
default choice: [1]:
2
Saved config file to /opt/aws/amazon-cloudwatch-agent/bin/config.json successfully.
Current config as follows:
{
        "agent": {
                "metrics_collection_interval": 60,
                "run_as_user": "root"
        },
★省略★
}
Please check the above content of the config.
The config file is also located at /opt/aws/amazon-cloudwatch-agent/bin/config.json.
Edit it manually if needed.
Do you want to store the config in the SSM parameter store?
1. yes
2. no
default choice: [1]:
2
Program exits now.
作成されたJSONファイルを持ってきます。
mv /opt/aws/amazon-cloudwatch-agent/bin/config.json .
さきほどのウィザードで、collectdを参照するようにしたので、CollectDもインストールしておきます。
sudo apt-get install collectd
以下でCloudWatchAgentを開始します。
/opt/aws/amazon-cloudwatch-agent/bin/amazon-cloudwatch-agent-ctl -a fetch-config -m onPremise -c file:config.json -s
停止は以下です。
/opt/aws/amazon-cloudwatch-agent/bin/amazon-cloudwatch-agent-ctl -a stop
AWS管理コンソールからCloudWatchを覗くと、メトリクスに、CWAgentという名前が増えているのがわかります。
GrafanaにCloudWatchを追加する
今度は、GrafanaからCloudWatchのメトリクスを参照するIAMロールのユーザを作成します。
付与するロールは以下の2つです。ユーザ名は例えば「grafana」としました。
- CloudWatchLogsReadOnlyAccess
- CloudWatchReadOnlyAccess
作成されたアクセスキーとシークレットキーを覚えておきます。
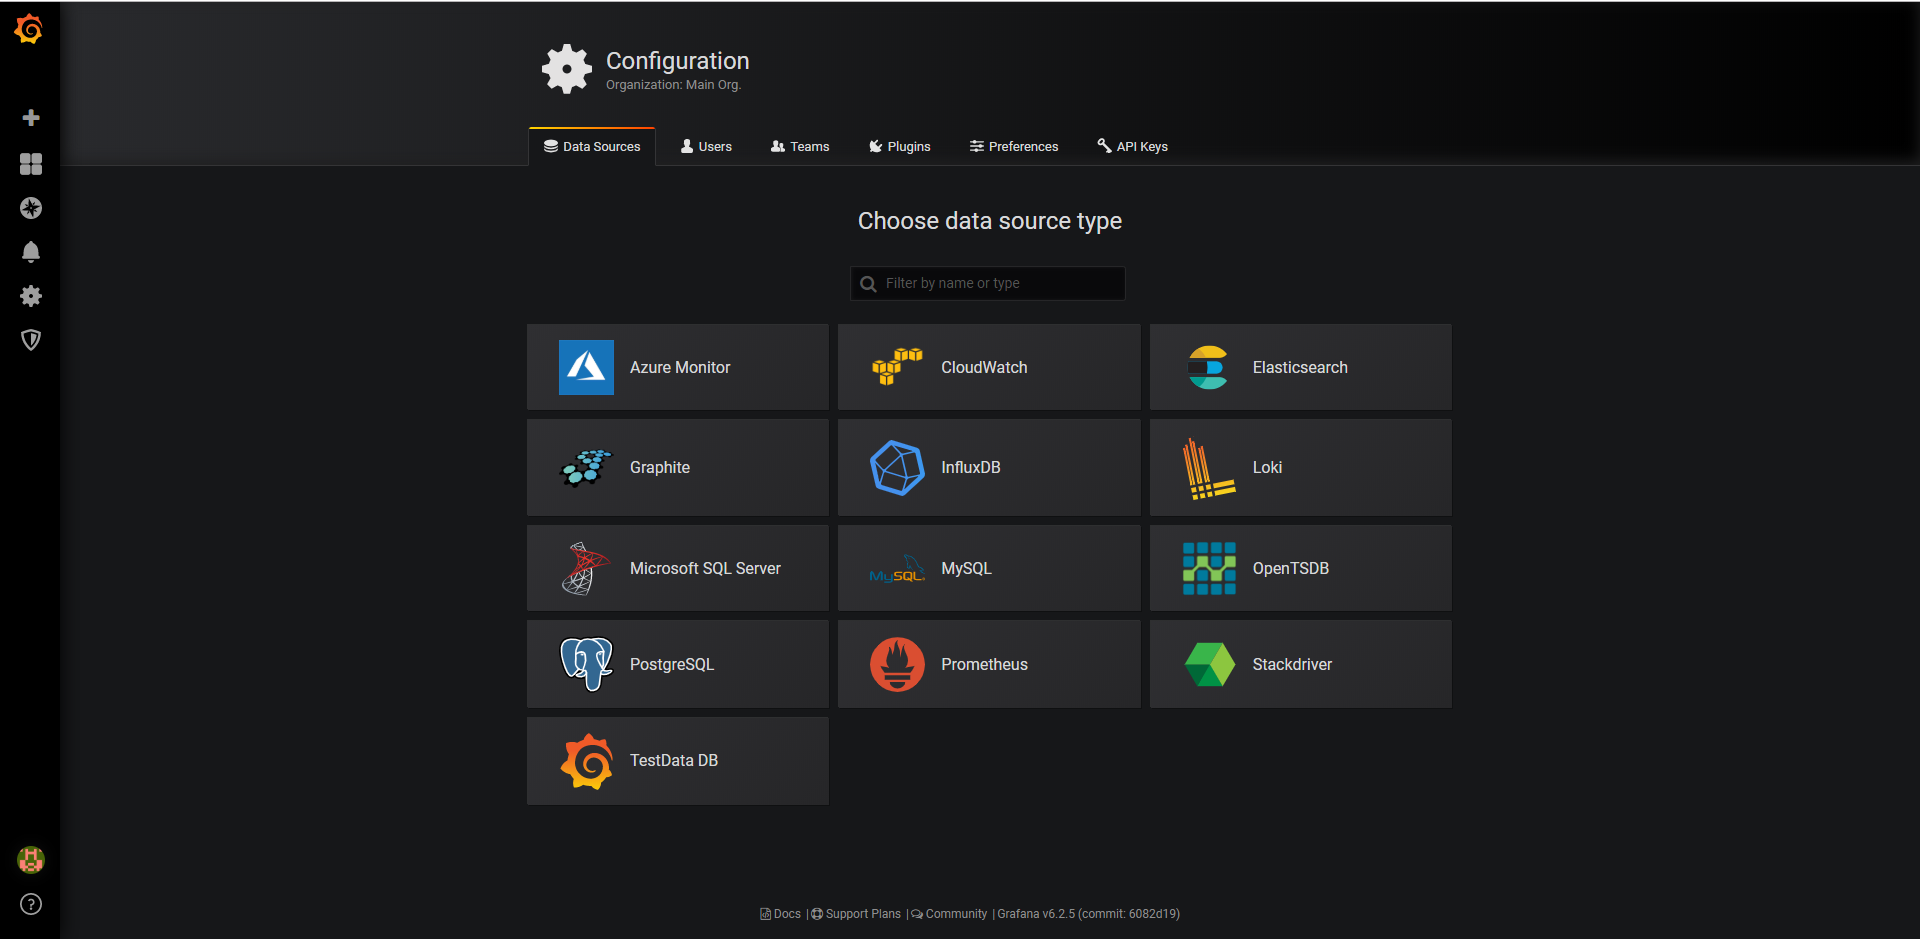
Grafanaに戻って、データソースを追加します。
data source typeとして、CloudWatchを選択します。
名前は適当にそのまま「CloudWatch」としています。
Auth Providerとして、「Access & secret key」を選択します。
Access Key IDとSeret access keyには、さきほど生成された「grafana」さんのアクセスキーとシークレットキーを指定します。
Default Regionには「ap-northeast-1」、Custom MetricsにはさきほどちょこっとCloudWatchのページで出てきた「CWAgent」を指定します。
最後に「Save & Test」ボタンを押下して、「Data source is working.」とでれば設定成功です。
Grafanaのダッシュボードを作成する
あとは、Grafanaのダッシュボードに先ほど追加したデータソースを張り付ければよいのですが、有志によるカッコいいダッシュボードがあるのでそれを使わせてもらいます。その名も「AWS Cloudwatch Browser」です。
AWS Cloudwatch Browser
https://grafana.com/grafana/dashboards/590
590番だそうです。
Grafanaの左側のナビゲーションにある「+」を押してImportを選択します。
ここに、590と入力します。
そうすると、画面が切り替わります。
CloudWatch Datasourceのところに、先ほど作成したデータソースの名前を入れます。「CloudWatch」かと思います。
最後に、「Import」ボタンを押下します。
これで準備完了です。
あとは、いろいろいじって浸りましょう。
例えば、以下の設定してみてください。
- Region: ap-northeast-1
- Namespace: CWAgent
- Metric: mem_used_percent
- Dimenson key: host
- Dimenson value: XXXXXX(環境依存)
ついでに、AWS料金もグラフにしちゃいましょう。
「AWS Billing」
https://grafana.com/grafana/dashboards/139
139番です。
Datasourceに「CloudWatch」を選択すれば、(少し表示まで時間がかかりますが)グラフが表示されたかと思います。
以上


