はじめに
Optunaはハイパーパラメータの自動最適化フレームワークです。主に機械学習のハイパーパラメータチューニングのために使用されるようです。
公式ホームページ
準備
まずはライブラリをインストールしましょう。
pip install optunaでインストールできます。
実験
今回は
x^2+y^2+z^2
の最小化問題を最適化しましょう。
目的関数の定義
はじめに目的関数を定義します。
# 目的関数を設定(今回はx^2+y^2+z^2)
def objective(trial):
    # 最適化するパラメータを設定
    param = {
        'x': trial.suggest_int('x', -100, 100),
        'y': trial.suggest_int('y', -100, 100),
        'z': trial.suggest_int('z', -100, 100)
    }
    # 評価値を返す(デフォルトで最小化するようになっている)
    return param['x'] ** 2 + param['y'] ** 2 + param['z'] ** 2
最適化実行
はじめにstudyオブジェクトを生成した後、最適化を実行していきます。
optimze()の引数であるn_trialsで探索回数を設定できます。
# studyオブジェクト生成
study = optuna.create_study()
# 最適化実行
study.optimize(objective, n_trials=500)
実行すると、以下のような表示がされます。(一部抜粋)
[I 2019-12-01 23:01:21,564] Finished trial#381 resulted in value: 121.0. Current best value is 4.0 with parameters: {'x': 0, 'y': 0, 'z': 2}.
[I 2019-12-01 23:01:21,705] Finished trial#382 resulted in value: 56.0. Current best value is 4.0 with parameters: {'x': 0, 'y': 0, 'z': 2}.
[I 2019-12-01 23:01:21,866] Finished trial#383 resulted in value: 88.0. Current best value is 4.0 with parameters: {'x': 0, 'y': 0, 'z': 2}.
[I 2019-12-01 23:01:22,012] Finished trial#384 resulted in value: 104.0. Current best value is 4.0 with parameters: {'x': 0, 'y': 0, 'z': 2}.
[I 2019-12-01 23:01:22,170] Finished trial#385 resulted in value: 426.0. Current best value is 4.0 with parameters: {'x': 0, 'y': 0, 'z': 2}.
[I 2019-12-01 23:01:22,361] Finished trial#386 resulted in value: 5249.0. Current best value is 4.0 with parameters: {'x': 0, 'y': 0, 'z': 2}.
[I 2019-12-01 23:01:22,523] Finished trial#387 resulted in value: 165.0. Current best value is 4.0 with parameters: {'x': 0, 'y': 0, 'z': 2}.
[I 2019-12-01 23:01:22,684] Finished trial#388 resulted in value: 84.0. Current best value is 4.0 with parameters: {'x': 0, 'y': 0, 'z': 2}.
最適化されたパラメータを確認したい場合は以下を加えましょう。
print(study.best_params)
最適化された目的関数値を確認したい場合は以下を加えましょう。
print(study.best_value)
また各試行を確認したい場合は, study.trialsから情報を取り出します. 以下のコードで試行回数, パラメータ, 目的関数値を表示することができます.
for i in study.trials:
    print(i.number, i.params, i.value)
コード
今回使用したコードを載せておきます.
# -*- coding: utf-8 -*-
import optuna
import matplotlib.pyplot as plt

# 目的関数を設定(今回はx^2+y^2+z^2)
def objective(trial):
    # 最適化するパラメータを設定
    param = {
        'x': trial.suggest_int('x', -100, 100),
        'y': trial.suggest_int('y', -100, 100),
        'z': trial.suggest_int('z', -100, 100)
    }
    # 評価値を返す(デフォルトで最小化するようになっている)
    return param['x'] ** 2 + param['y'] ** 2 + param['z'] ** 2

if __name__ == '__main__':
    # studyオブジェクト生成
    study = optuna.create_study()
    # 最適化実行
    study.optimize(objective, n_trials=500)

    epoches = []    # 試行回数格納用
    values = []    # best_value格納用
    best = 100000    # 適当に最大値を格納しておく
    # best更新を行う
    for i in study.trials:
        if best > i.value:
            best = i.value
        epoches.append(i.number+1)
        values.append(best)

    # グラフ設定等
    plt.plot(epoches, values, color="red")
    plt.title("optuna")
    plt.xlabel("trial")
    plt.ylabel("value")
    plt.show()
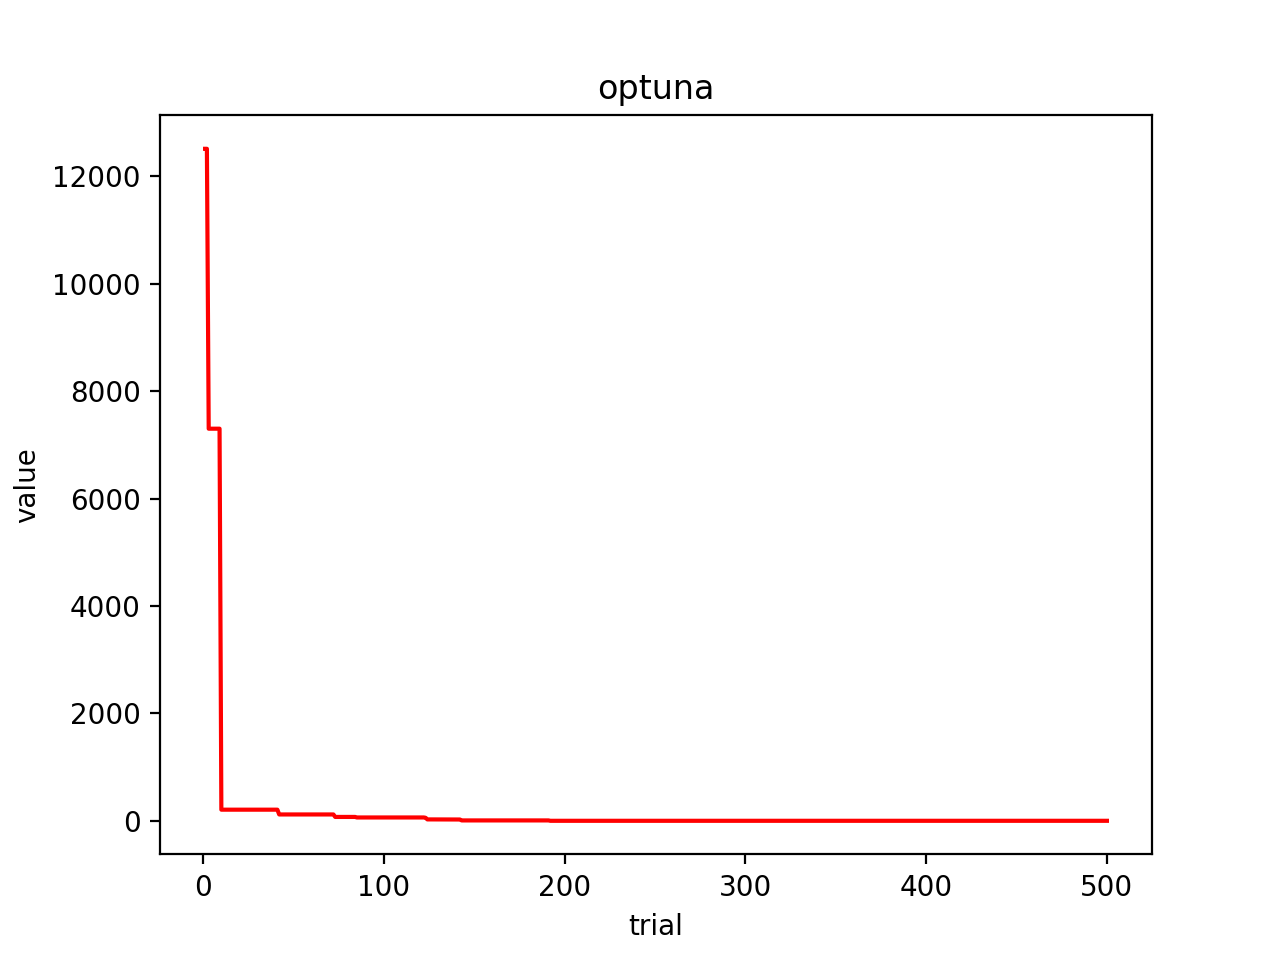
結果
今回の実験結果の図は以下のようになりました.
best_valueの値は3.0でしたので真の最適解には達しませんでしたが, 早い段階で収束してきていることが確認できました。