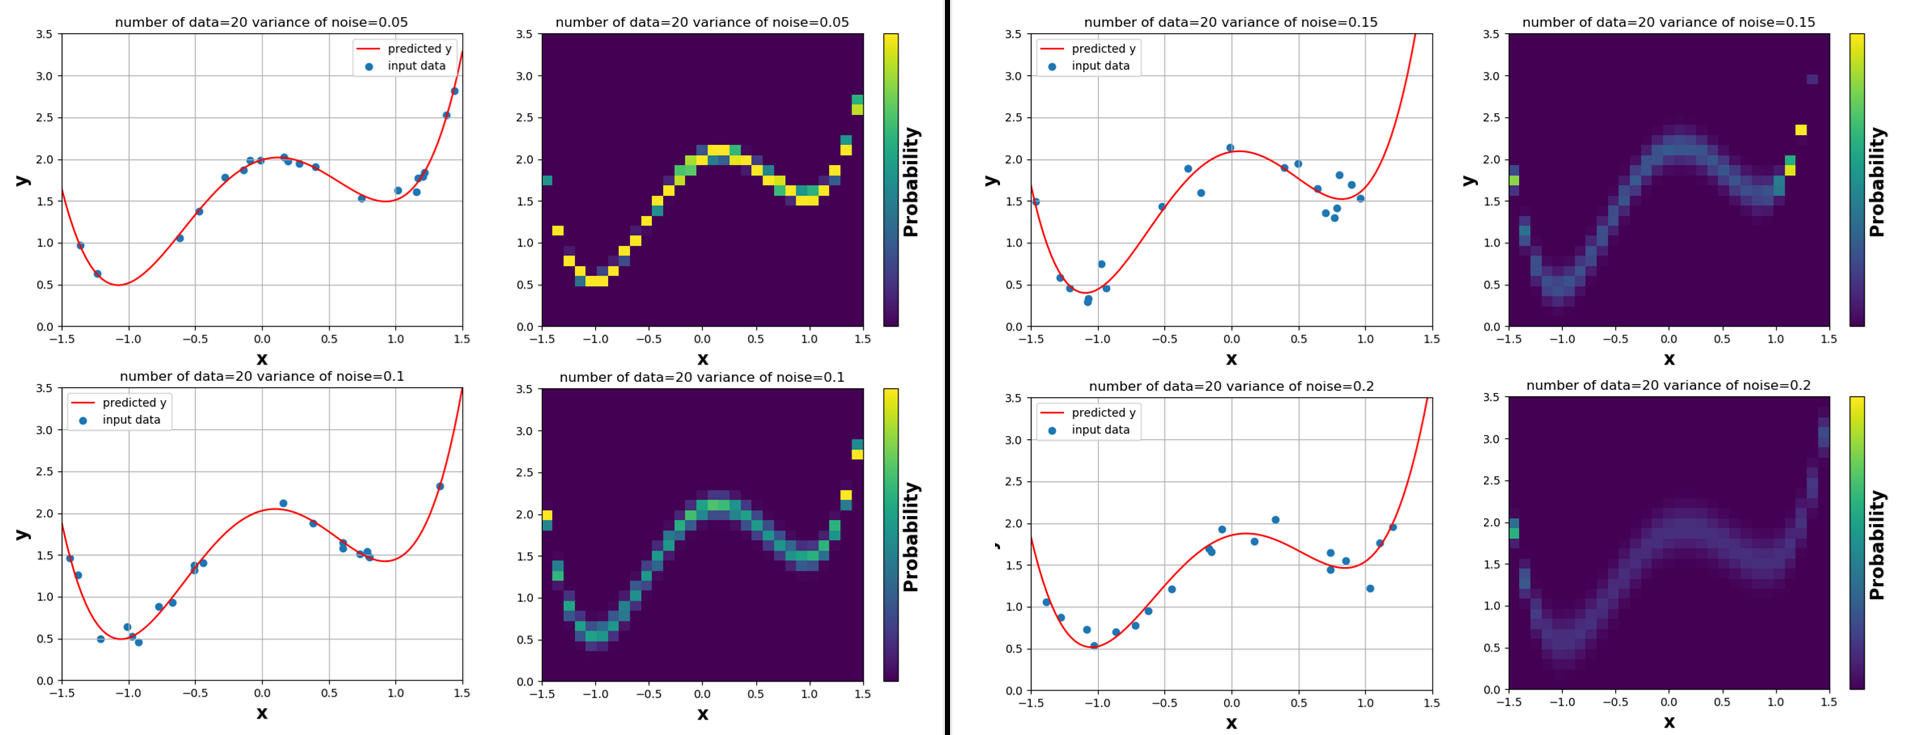
須山敦志著の『ベイズ推論による機械学習入門』の第3章を読みました。3.5章 線形回帰の例 をpythonで実装してみました。ちなみに、Juliaによる実装が著者のgitページにあるみたいです。
記号の使い方
小文字の太字は縦ベクトル、大文字の太字は行列は表します。
$D$次元ガウス分布を、平均パラメータベクトル$\boldsymbol{\mu}\in \mathbb{R}^D$, 共分散行列${\bf \Sigma}\in \mathbb{R}^{D \times D}$を用いて
$$
{\mathcal N}({\bf x}|{\bf \mu},{\bf \Sigma})=\frac{1}{\sqrt{(2\pi)^D|{\bf \Sigma}|}} {\rm exp} \left\{ -\frac{1}{2}({\bf x}-\boldsymbol{\mu})^{\rm T}{\bf \Sigma^{-1}({\bf x}-\boldsymbol{\mu})} \right\}
$$
で定義します。簡略のために精度行列${\bf \Lambda}={\bf \Sigma}^{-1}$を用います。
理論
詳細は『ベイズ推論による機械学習入門』の3.5章を読んでください。ここでは、前提と結論のみを書くに留めます。
前提
線形回帰モデルでは、実数の出力値$y_n$は入力ベクトル${\bf x}_n$,パラメータ${\bf w}$,ノイズ成分$\epsilon_n$を用いて次のようにモデル化されます。
\begin{align}
y_n = {\bf w}^{\rm T}{\bf x}_n+\epsilon_n
\end{align}
ノイズ成分$\epsilon_n$は平均ゼロのガウス分布${\mathcal N}(\epsilon_n|0,\lambda^{-1})$に従っているとします。ここで$\lambda>0$は既知の精度パラメータです。以上をまとめて、
\begin{align}
p(y_n|{\bf x}_n,{\bf w}) = {\mathcal N}(y_n|{\bf w}^{\rm T}{\bf x}_n,\lambda^{-1})
\end{align}
と書けます。今回はパラメータ${\bf w}$を求めるのが目的です。次のような事前分布を設定します。
\begin{align}
p({\bf w}) = {\mathcal N}({\bf w}|{\bf m},{\bf \Lambda}^{-1})
\end{align}
平均パラメータベクトル${\bf m}$と精度行列${\bf \Lambda}$はハイパーパラメータです。
結論
データ$({\bf X},{\bf Y})$を観測したあとの$\bf{w}$の事後分布は次のように書けます。
\begin{align}
p({\bf w}|{\bf X,Y}) = {\mathcal N}({\bf w}|\hat{\bf m}, \hat{\bf \Lambda}^{-1}) \\
\hat{\bf \Lambda} = \lambda \sum_{n=1}^N {\bf x_n}{\bf x_n}^{\rm T} + {\bf \Lambda} \\
\hat{\bf m} = \hat{\bf \Lambda}(\lambda\sum_{n=1}^N y_n{\bf x_n}+{\bf \Lambda}{\bf m})
\end{align}
ここで、データ$({\bf X},{\bf Y})$は
\begin{align}
{\bf X}= \{{\bf x}_1,{\bf x}_2,\cdots,{\bf x}_N\} \\
{\bf Y}= \{y_1,y_2,\cdots,y_N\}
\end{align}
であり、入力ベクトル${\bf x}_n$を次で定義します。
\begin{align}
{\bf x}_n= \{1,x_n,x_n^2,\cdots,x_n^{M}\} \\
\end{align}
また、$N$個のデータを観測したあと、入力データ${\bf x_{*}}=(1,\cdots,x_{*}^M)$にたいして、$y_{*}$が観測される予測分布は次で与えられます。
\begin{align}
p(y_*|{\bf x}_*) = {\mathcal N}(y_*|\mu_*,\lambda_*^{-1}) \\
\end{align}
\mu_* = {\bf m}^{\rm T}{\bf x}_* \\
\lambda_*^{-1} = \lambda^{-1}+{\bf x}_*^{\rm T}{\bf \Lambda}^{-1}{\bf x}_*
実装
まず、dim_data次式にノイズを与えた学習データ$({\bf X},{\bf Y})$を与える関数を用意する。この関数をdim_predict$(=M)$次式でfittingすること(=${\bf w}$を知ること)が目標です。
coefficientはdim_data次関数の各項の係数を格納する配列で、number_of_pointsはデータ数$(=N)$、variance_of_noiseはノイズの大きさ$(=\lambda)$を意味します。以下のアルゴリズムの詳細はこちらでも議論しました。
# dim_data次多項式にノイズを与えた点(X,noised_Y)の集合を出力する関数
def give_data(coefficient,number_of_points,dim_data,variance_of_noise,xmin=-1.5,xmax=1.5):

	X = np.zeros(number_of_points)
	Y = np.zeros(number_of_points)
	noised_Y = np.zeros(number_of_points)

	for i in range(0,number_of_points):
		X[i] = random.uniform(xmin,xmax)

		for j in range(0,dim_data+1):
			Y[i] = Y[i] + coefficient[j]*X[i]**j

		noised_Y[i] = np.random.normal(loc=Y[i],scale=variance_of_noise)

	return X,noised_Y
次に与えたデータ$({\bf X},{\bf Y})$をdim_predict次式でfitting(=${\bf w}$を知る)する関数を定義します。expectation_vector$(={\bf m})$とprecision_matrix$(={\bf \Lambda})$はともにハイパーパラメータである。sum1とsum2はそれぞれ、$\sum_{n=1}^N {\bf x_n}{\bf x_n}^{\rm T}$と$\sum_{n=1}^N y_n{\bf x_n}$を表し、new_expectation_vector$(=\hat{{\bf m}})$とnew_precision_matrix$(=\hat{{\bf \Lambda}})$を求めるために予め計算します。
def predict(dim_predict, dim_data, coefficient, expectation_vector, precision_matrix,number_of_data,variance_of_noise):

	#dim_data次多項式にノイズを与えた点(X,noised_Y)の集合を格納する。
	X,Y = give_data(coefficient,number_of_data,dim_data,variance_of_noise)

	#更新後のパラメータを計算するための準備
	input_vec = np.zeros((number_of_data,dim_predict+1))

	Sum1 = np.zeros((dim_predict+1,dim_predict+1))
	Sum2 = np.c_[np.zeros(dim_predict+1)] #縦ベクトルにしておく

	for j in range(0,number_of_data):
		#各xについてinput_vector = (1,x,x^2,x^3,x^4,…)をつくる。
		for i in range(0,dim_predict+1):
			input_vec[j][i] = X[j]**i

		#new_precision_matrix,new_expectation_vectorに必要なSum1とSum2を求める。
		Sum1 = Sum1 + np.dot(input_vec[[j]].transpose(),input_vec[[j]])
		Sum2 = Sum2 + Y[j]*input_vec[[j]].transpose()

	#学習後のパラメータ
	new_precision_matrix = variance_of_noise * Sum1 + precision_matrix
	new_expectation_vector = np.dot(np.linalg.inv(new_precision_matrix),(variance_of_noise*Sum2 + np.dot(precision_matrix,np.c_[expectation_vector]))) #縦ベクトル

	#predicted functionをpredict_y[x]に格納
	xmin_predicted = -1.5
	xmax_predicted = +1.5

	predict_x = np.linspace(xmin_predicted, xmax_predicted, 100)
	predict_y = np.zeros(100)
	for j in range(0,100):
		for i in range(0,dim_predict+1):
			predict_y[j] = predict_y[j] + new_expectation_vector[i]*predict_x[j]**i

	#predicted function predict_y[x]と入力データ(X,Y)を同一グラフにプロット
	plt.scatter(X,Y,label="input data")
	plt.plot(predict_x,predict_y,c="red",label="predicted y")
	plt.legend()
    plt.title("number of data="+str(number_of_data)+" variance of noise="+str(variance_of_noise))
	plt.xlabel("x",fontsize=16,fontweight='bold')
	plt.ylabel("y",fontsize=16,fontweight='bold')
	plt.xlim([xmin_predicted,xmax_predicted])
	plt.ylim([0,3.5])
	plt.grid(True)
	plt.show()

	return new_precision_matrix,new_expectation_vector
次に未知の入力値$x_{*}$に対して各々の$y$の値の信頼度を計算します
expectation_vectorは、${\mu}_{*}$を意味して、
precisionは${\lambda}_{*}^{-1}$を意味します。
def probability(dim_predict,variance_of_noise,new_precision_matrix,new_expectation_vector):

	xmin_probability_density = -1.5
	xmax_probability_density = +1.5

	N = 30 #カラープロットの細かさ
	x = np.linspace(xmin_probability_density,xmax_probability_density,N)
	y = np.linspace(0,3.5,N)
	probability = np.zeros((N,N))

	for i in range(0,N):
		predicted_input_vector = np.zeros(dim_predict+1)

		#predicted_input_vector = (1,x,x^2,x^3,x^4,…)をつくる。
		for k in range(0,dim_predict+1):
			predicted_input_vector[k] = x[i]**k

		expectation = np.dot(new_expectation_vector.transpose(),predicted_input_vector.transpose())
		precision = 1.0/variance_of_noise + predicted_input_vector @ np.linalg.inv(new_precision_matrix) @ predicted_input_vector.transpose()

		for j in range(0,N):
			probability[j][i] = normal_distribution(y[j],expectation,precision)

	#確率密度関数をカラープロット
	x, y = meshgrid(x, y) #グリッドをつくる
	plt.pcolor(x,y,probability)
	cbar = plt.colorbar(ticks=[]) #カラーバーのticksをかかない。
	cbar.set_label('Probability', fontsize=16,fontweight='bold')
    plt.title("number of data="+str(number_of_data)+" variance of noise="+str(variance_of_noise))
	plt.clim(0,100) #カラーバーの範囲
	plt.xlabel("x",fontsize=16,fontweight='bold')
	plt.ylabel("y",fontsize=16,fontweight='bold')
	plt.xlim([xmin_probability_density,xmax_probability_density])
	plt.ylim([0,3.5])
	plt.show()
正規分布を返す、normal_distributionを定義します。
def normal_distribution(x,expectation,precision):

    convariance = 1.0/precision

    return 1.0/(math.sqrt(2.0*math.pi)*convariance**2)*math.exp(-(x-expectation)**2/(2.0*convariance**2))
最後にmain関数を用意して完成です。
if __name__ == "__main__":

	#次元を指定。dim_data次元の正解データをdim_predict次元の関数でfittingする。
	dim_predict = 4
	dim_data = 4

	#正解のdim_data次元関数の係数。dim_data + 1 要素必要。
	coefficient = [2,0.5,-2,0,1] #左から0次,1次,2次,3次,4次

	#データ(X,noised_Y)を与えるパラメータ
	number_of_data = 1000 #データの数
	variance_of_noise = 0.1 #ノイズの大きさ

	#coefficientの要素数がdim_data + 1でない場合は終了。
	if len(coefficient) != dim_data + 1:
		print("Error. Number of coefficients are wrong.")
		sys.exit()

	#ベイズ推定のHyper parameters
	expectation_vector = np.ones(dim_predict+1)
	precision_matrix = np.zeros(dim_predict+1)

	new_precision_matrix,new_expectation_vector= predict(dim_predict, dim_data, coefficient, expectation_vector, precision_matrix,number_of_data,variance_of_noise)
	probability(dim_predict, variance_of_noise,new_precision_matrix, new_expectation_vector)
結果と考察
データ数を増やすと正解に近づく
ひとまず、$y=x^4-2x^2+0.5x+2$にノイズを与えた訓練データを学習させてみました。dim_predict=4としました。与えるデータ数(図中の青点の数)を増やしていくと、predicted function(図中の赤線)が徐々に$y=x^4-2x^2+0.5x+2$に近づくことがわかります。
下の表は、訓練後に得られた4次の予想曲線の係数が、データ数($=N$)の増加に伴って正解に近づいている様子を表しています。new_expectation_vector$(={\hat{\bf m}})$をprintすることによって、これらの係数を確認することができます。
| number of data(N) | $x^4$ | $x^3$ | $x^2$ | $x$ | $x^0$ |
|---|---|---|---|---|---|
| 4 | 11.203 | 29.473 | 14.500 | -11.187 | -4.937 |
| 5 | 8.381 | 16.048 | -8.213 | -27.248 | -8.917 |
| 10 | 0.861 | 0.051 | -1.733 | 0.327 | 1.985 |
| 35 | 1.010 | -0.026 | -2.063 | 0.518 | 2.032 |
| 160 | 1.022 | -0.010 | -2.050 | 0.505 | 2.017 |
| 785 | 1.001 | -0.006 | -1.999 | 0.505 | 1.995 |
| Truth | 1.000 | 0.000 | -2.000 | 0.500 | 2.000 |
同じデータ数でも、ノイズが小さい方が信頼度が高い
同じく、$y=x^4-2x^2+0.5x+2$にノイズを与えた訓練データ20個($=N$)を学習させ、dim_predict=4としてみました。このとき、ノイズの大きさvariance_of_noise($=\lambda$)が大きいほうが信頼度が小さい様子がカラープロットから分かります。カラープロットはその点でのpredictの信頼度を表しており、黄色は高信頼、紫色は低信頼を表しています。ノイズが大きい場合は、学習の結果に自信がないことがわかります。
下の表は、訓練後に得られた4次の予想曲線の係数が、ノイズの大きさ($=λ$)の減少に伴って正解に近づいている様子を表しています。
| variance of noise(λ) | $x^4$ | $x^3$ | $x^2$ | $x$ | $x^0$ |
|---|---|---|---|---|---|
| 0.20 | 1.005 | 0.119 | -1.827 | 0.388 | 1.853 |
| 0.15 | 1.250 | 0.352 | -2.285 | 0.259 | 2.086 |
| 0.10 | 1.078 | 0.053 | -2.129 | 0.416 | 2.027 |
| 0.05 | 0.951 | 0.037 | -1.928 | 0.460 | 1.990 |
| Truth | 1.000 | 0.000 | -2.000 | 0.500 | 2.000 |
データが足りていないところの信頼度は低くなる
$y=x^4-2x^2+0.5x+2$にノイズを与えた訓練データ10個($=N$)を学習させ、dim_predict=4としてみました。学習データが足りていない場所($x$が小さいところ)では信頼度が低くなっていることがわかります。

