モチベーション
- 理論駆動 (NDVIとか) のリモセン触ってたけど、データ駆動で何ができるか掴みたい。
- 可視領域の衛星画像の取得が簡単になってきたみたいなので、その感覚を得たい。
- 犬猫分類や文字認識だけでなく、人間の目でも微妙なラインを解かせてみたい。
やること概要
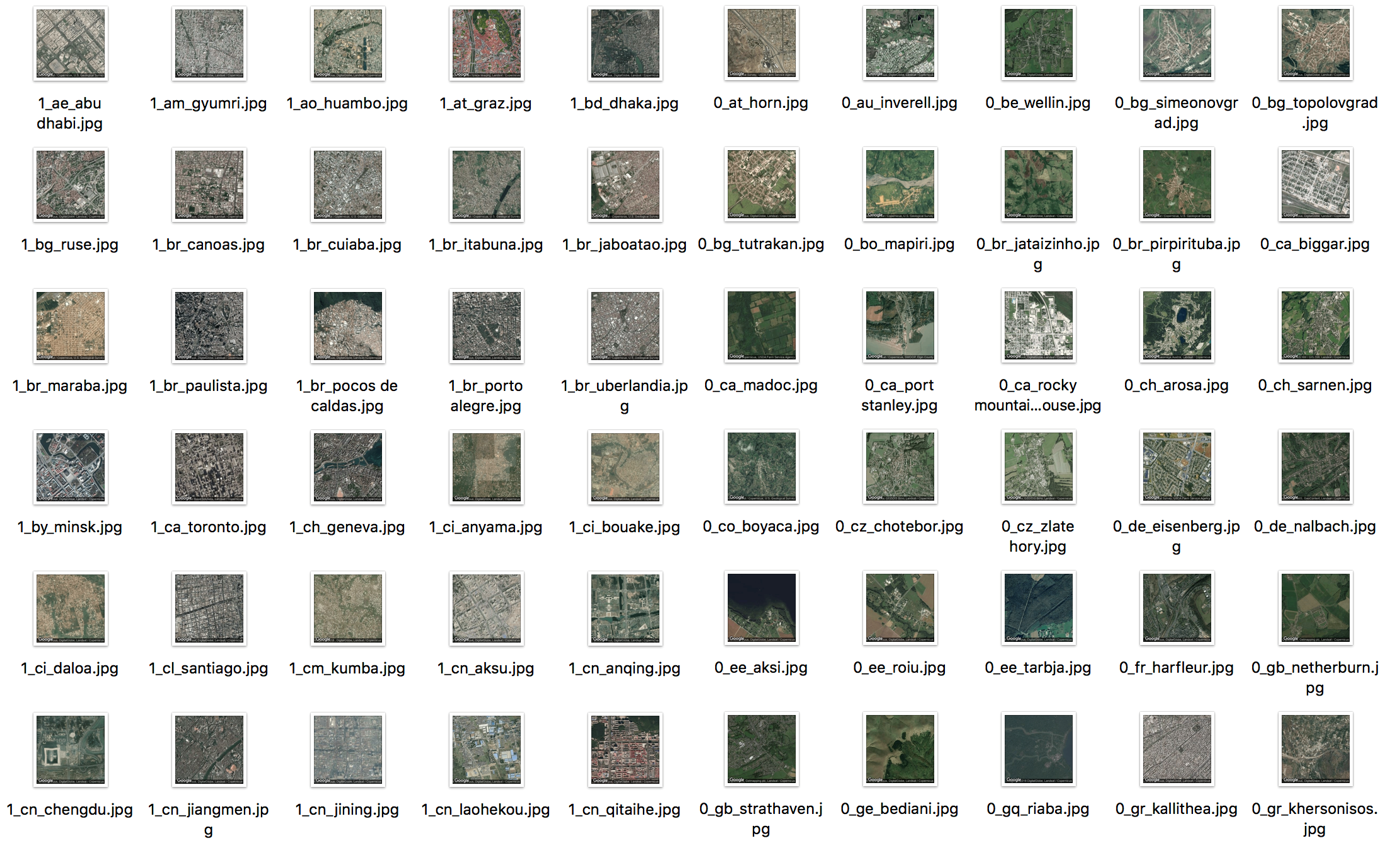
都市人口データセットに含まれる全世界の47,979都市について、都市の中心地周辺の町並み衛星画像から、
データ中人口全都市の上位5%以上"都会"(142,628人以上)と、人口中央値未満"田舎"(10,779人未満)の分類を試みる。画像中心の定義は市役所の位置(Google Geocoding APIに都市名を投げるとその位置情報が返ってくるようなので)都会を上位5%にしたのは、分布が右に裾を引く桁違いの上位都市を"都会"として検出したかったため。
以下に"都会"(左5列)と"田舎"(右5列)の画像を示す。人間の目ではなんとなくわかる?
使うデータやAPI
都会と田舎でそれぞれ2,168データずつ準備する。上位5%の数に合わせるのとGoogleAPIの課金を最小限に抑えたい。。
- 都市名と人口のCSVはkaggleのデータセットから
- 都市中心地の緯度経度情報の取得はGoogle Geocoding API
- 衛星画像の取得はGoogle Static Maps API, Zoom Levelは14, Sizeは254x254を採用
分類手法
手法はVGG16, ResNet50, Inception v3のファインチューニングで結果が良かったものを採用する。
衛星画像分類にかかるMITの論文でVGG-16やResNet-50のファインチューニングでイケてるみたいなので、それに倣う。
訓練データ: 4,336枚のうち8割を縦横反転して拡張する。検証データ: 4,336枚のうち2割を使う。
日本のデータは除いておき、あとでモデルに当てはめる。
実装
1. 都市人口データの読込とラベル付け
Kaggleからダウンロードしてきたデータを読み込み、人口上位5%と50%未満にラベル付け。
def load_popdata(rrl_th=50, urb_th=95):
    """
    Importing city population data, and labeling urban(1) and rural(0)
    @ param rrl_th: threshold of population percentile as for defined rural
    @ param urb_th: threshold of population percentile as for defined urban
    @ return df_p: lbl added city population dataset
    """
    df = pd.read_csv("../data/worldcitiespop.csv")
    df_p = df[df.Population > 0.0]
    df_p.drop(labels=['AccentCity'], axis=1, inplace=True)
    df_p.dropna(how='any', inplace=True)
    df_p.reset_index(drop=True, inplace=True)
    smry = df_p.Population.describe(percentiles=[rrl_th/100, urb_th/100])
    urb_th_pop = smry[5] # Top 5 percent population city is defined as urban
    rrl_th_pop = smry[4] # Bottom 50 percent population city is defined as rural
    df_p['lbl'] = df_p.Population.apply(lambda x: 1 if x > urb_th_pop else (0 if x < rrl_th_pop else 2))
    df_p = df_p[df_p.lbl < 2]
    return df_p
"都会"のレコード数に合わせて"都会"と"田舎"を抜き出す。未知データとして日本は別に切り出す。
def df_sampling(df, num):
    """
    Sampling "num" dataset for each urban and rural
    @ df: city, country, population and lbl
    @ param num: the number of sampling each urban and rural dataset
    @ return out: sampled df
    @ return df_jp: jp dataset
    """
    df_jp = df[df.Country == 'jp']
    df = df[df.Country != 'jp']
    out0 = df[df.lbl == 0].sample(n=num, random_state=0)
    out1 = df[df.lbl == 1].sample(n=num, random_state=0)
    out = pd.concat([out0, out1])
    out.reset_index(drop=True, inplace=True)
    df_jp.reset_index(drop=True, inplace=True)
    return out, df_jp
2. 都市中心の緯度経度の取得
都市名と国名のコンビネーションで緯度経度を取得。同じ国に同名の都市がある場合(大阪府堺市と福井県坂井市)は同じ位置が参照されるが今回は気にしない。
(検証用データにミスラベルされたデータが入ってしまうと良くないので本当はケアしたい)
def lookup_latlng(city_df, api_key, fn):
    """
    Convert address name to latitude and longitude
    @ param city_df: city, country, population and lbl
    @ param api_key: APY Key for Google Geocoding API
    @ retrun city_df: lat, lng added city data
    """
    city_l = city_df['City'] + ',+' + city_df['Country']
    lat = []
    lng = []
    ggl_url = "https://maps.googleapis.com/maps/api/geocode/json?address="
    # GEOCODING Lookup, by Google Maps API
    for w in city_l:
        url = ggl_url + w + "&key=" + api_key
        url = url.replace(' ', '+')
        try:
            response = urllib.request.urlopen(url)
        except urllib.error.HTTPError as e:
            print(e)
            lat_tmp, lng_tmp = 0, 0
        else:
            content = json.loads(response.read().decode('utf8'))
            if content['status'] == 'OK':
                lat_tmp = content['results'][0]['geometry']['location']['lat']
                lng_tmp = content['results'][0]['geometry']['location']['lng']
            else:
                lat_tmp, lng_tmp = 0, 0 # return 0 if status is NG
        lat.append(lat_tmp)
        lng.append(lng_tmp)
    city_df['lat'] = lat
    city_df['lng'] = lng
    city_df = city_df[city_df.lat != 0]
    city_df.to_csv('../data/'+ fn + '_city_latlng.csv')
    return city_df
3. 衛星画像の取得と保存
あとでKerasのflow_from_directoryにてデータ読込予定なので、それに合わせたディレクトリ階層構造で保存する。
具体的にはtrain, testフォルダの下にそれぞれurban, ruralフォルダをつくり、画像データを保存する。
def get_ggl_image_sep(city_df, zoom=14, size=254, split_rat=.80, img_dir='../imgs/', api_key=''):
    """
    Get google satellite image via Google Map API
    @ param city_df: df including city name and latlng
    @ param zoom: zoom level
    @ param size: image size
    @ param split_rat: train vs test ratio (default is 80 vs 20)
    @ param img_dir: directory pass for image folder
    @ param api_key: api key for Google Static Maps API
    """
    # Map Configue
    city_df = city_df.take(np.random.permutation(len(city_df))) #Shuffle the order of dataset
    lat = city_df['lat']
    lng = city_df['lng']

    city_name = city_df['lbl'].astype(str) + '_' + city_df['Country'] + '_' + city_df['City']
    city_name = city_name.replace(' ', '_')
    im_type = "satellite"
    ggl_url = "https://maps.googleapis.com/maps/api/staticmap"
    cnt_urb_saved, cnt_rrl_saved = 0, 0

    # count datasets
    cnt_urb = sum(city_df.lbl == 1)
    cnt_rrl = sum(city_df.lbl == 0)

    # Scraping google map
    for i in city_name.index:
        # Issue the image url
        img_url = ggl_url + "?center=" + str(lat[i]) + "," + str(lng[i]) + "&zoom=" + str(zoom) + "&size=" + str(size) + "x" + str(size) + "&maptype=" + im_type + "&key=" + api_key
        # Save images
        if city_name[i][0] == '1' and cnt_urb_saved <= int(cnt_urb * split_rat):
            save_path = 'train/urban/'
            cnt_urb_saved += 1
        elif city_name[i][0] == '0' and cnt_rrl_saved <= int(cnt_rrl * split_rat):
            save_path = 'train/rural/'
            cnt_rrl_saved += 1
        elif city_name[i][0] == '1' and cnt_urb_saved > int(cnt_urb * split_rat):
            save_path = 'test/urban/'
            cnt_urb_saved += 1
        elif city_name[i][0] == '0' and cnt_rrl_saved > int(cnt_rrl * split_rat):
            save_path = 'test/rural/'
            cnt_rrl_saved += 1
        try:
            urllib.request.urlretrieve(img_url, img_dir  + save_path + city_name[i] + ".jpg")
        except urllib.error.HTTPError as e:
            print('something wrong at ' + city_name[i] + ' at row ' + str(i))
            print(e)
4. 読み込みデータの生成
3のtrain, testフォルダからデータを読み込む。訓練データは上下左右反転して拡張。
# Generator for train and test data (just rotate horizontal, and vertical)
train_datagen = ImageDataGenerator(
    rescale=1.0 / 255,
    horizontal_flip=True,
    vertical_flip=True)

test_datagen = ImageDataGenerator(rescale=1.0 / 255)

train_generator = train_datagen.flow_from_directory(
    '../imgs/train',
    target_size=(254, 254),
    color_mode='rgb',
    batch_size=32,
    class_mode='binary')

validation_generator = test_datagen.flow_from_directory(
    '../imgs/test',
    target_size=(254, 254),
    color_mode='rgb',
    batch_size=32,
    class_mode='binary')
5. モデルの作成
3つのモデルをベースにファインチューニング。こちらの記事を参考に。
https://employment.en-japan.com/engineerhub/entry/2017/04/28/110000
# Load the VGG model
vgg_model = vgg16.VGG16(weights='imagenet', include_top=False)
# Load the Inception_V3 model
inception_model = inception_v3.InceptionV3(weights='imagenet', include_top=False)
# Load the ResNet50 model
resnet_model = resnet50.ResNet50(weights='imagenet', include_top=False)

def apply_model(base_model=vgg_model):
    """
    Fine tuning of base model
    @ param base_model: base model to use. should be vgg_model, inception_model or resnet_model
    """
    # Define output layer
    x = base_model.output
    x = GlobalAveragePooling2D()(x)
    predictions = Dense(1, kernel_initializer="glorot_uniform", activation="sigmoid", kernel_regularizer=l2(.0005))(x)

    model = Model(inputs=base_model.input, outputs=predictions)

    # not update weights during base_model
    for layer in base_model.layers:
        layer.trainable = False

    opt = SGD(lr=.01, momentum=.9)
    model.compile(optimizer=opt, loss='binary_crossentropy', metrics=['accuracy'])

    checkpointer = ModelCheckpoint(filepath='model.{epoch:02d}-{val_loss:.2f}.hdf5', verbose=1, save_best_only=True)
    csv_logger = CSVLogger('model.log')

    reduce_lr = ReduceLROnPlateau(monitor='val_loss', factor=0.2,
                      patience=5, min_lr=0.001)

    history = model.fit_generator(train_generator,
                        steps_per_epoch=3400,
                        epochs=10,
                        validation_data=validation_generator,
                        validation_steps=860,
                        verbose=1,
                        callbacks=[reduce_lr, csv_logger, checkpointer])
結果と考察
一番良かったVGG16でval_acc=0.83, val_loss=0.45に落ち着いた。いくつか切り出しておいた日本のデータで分類結果を確認する。(図中のパスはtrainフォルダから引っ張っているが、jp_imgsフォルダは学習に用いていない)

画像サイズについて最初は160x160で試したが、あまり精度が出ず254x254まで引き上げて精度が出た。
またファインチューニングのもとになるモデルでも結果はだいぶ異なっていた。
犬猫や手書き文字のように画像全体を見て判断するというより、ビルや家の数などを模様として判断する(?)ためにはある程度の解像度と模様を識別するような訓練がなされていたかが重要そうに感じる。
今回は人口をターゲットにしたけど、収入とか別の指標でもいけそう。
ちなみに高解像度衛星画像で収入を予測するサービスはすでに試行されている。
この手の指標はセンサスで取れちゃうから、それを高頻度に更新できたり、他国の情報をとれたり、(心理的含め)行きづらい場所や訊きにくい情報を集められるというところが価値になるんだろうけど、その価値を受け取れるプレイヤーは誰なんだろうと考えてしまう。。。
ソースコード
リーダブルになり次第ここにあげるはず。必要なパッケージ情報などもそちらで。
なぞる場合はGoogle Geocoding APIおよびGoogle Static Maps APIのAPI_KEYが必要です。
環境や前提条件
AWSのGPU環境を利用。(p2.xlarge, tensorflow_p36をアクティベートして使用)
AWS周りの扱いと多くのコードはこちらを参考にしました。
https://employment.en-japan.com/engineerhub/entry/2017/04/28/110000