はじめに
matplotlib2tikzというパッケージを発見.
このパッケージはmatplotlibでグラフ作って, Tikzという画像を生成できる言語で出力させることができます.
Tikzについては以下の記事でお願いします.
環境
- MacOS Sierra 10.12.6
- python 3.6.3
- matplotlib 3.0.0
- numpy 1.14.5
- Pillow 5.4.1
- six 1.11.0
- matplotlib2tikz 0.6.18
インストール
terminalに次のように打ち込んでインストール
pip install matplotlib2tikz
依存関係にあるパッケージは
matplotlib, numpy, Pillow, six
のようなのでなければ追加でインストールされます.
使い方
使う前に以下のようにパッケージを読み込ませる.
from matplotlib2tikz import save as tikz_save
普段通りmatplotlibでplotしてsavefigを呼び出す代わりに
tikz_save('hoge.tex')
で保存すればよいようです.
やってみる
では実践.
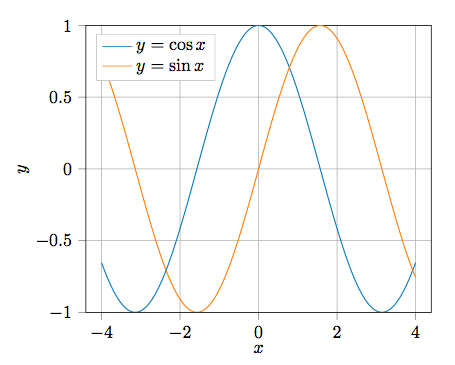
$y=\sin x$と$y=\cos x$を描いてみたいと思います.
pythonのソースコードで以下のようにします.
当然tex内に埋め込むので数式環境は$で囲めば使用することが可能です.
import matplotlib.pyplot as plt
import matplotlib2tikz.save as tikz_save
import numpy as np

x = np.linspace(-4.0, 4.0, 100)
y1 = np.cos(x)
y2 = np.sin(x)

plt.plot(x, y1, label = '$y=\cos x$')
plt.plot(x, y2, label = '$y=\sin x$')

plt.xlabel('$x$')
plt.ylabel('$y$')

plt.ylim(-1.0, 1.0)

# 凡例を表示
plt.legend()

# グリッドを表示
plt.grid()

# 保存
tikz_save('scos.tex')
このようにすると, scos.texが出来上がるので, このできたtexを挿入しますがプリアンブルに以下を追加します.
\usepackage[utf8]{inputenc}
\usepackage{fontspec} % This line only for XeLaTeX and LuaLaTeX
\usepackage{pgfplots}
fontspecはXeLaTexかLuaLaTexを使うときに入れればいいようです.
今回はplatexでコンパイルするのでutf8とpgfplotsを使用します.
\documentclass[border=0.5pt,class=jsarticle]{standalone}
\usepackage[dvipdfmx]{graphicx}
\usepackage[utf8]{inputenc}
\usepackage{pgfplots}

\begin{document}
    \input{scos.tex}
\end{document}
そしてplatex⇨dvipdfmxでpdfにすると以下のような絵が現れます.
まとめ
綺麗なグラフが出てきた!