本家ブログ(実践ケモインフォマティクス)もよろしくお願いします。
変数選択は精度の高い予測モデルの構築において非常に重要といえる。
本記事では、変数選択手法の一つであるBorutaについてまとめた。
Borutaについて
- ランダムフォレスト(RF)の変数重要度に基づく変数選択方法
- 目的変数と関係のない適当な特徴量(shadow features)と、オリジナル変数の重要度を比較することで説明変数を選択する
- 詳しい説明は金子研HP参照
詳しい手順
- 特徴量をコピーして新しい特徴量(shadow features)を作りだす。(複数)
- 新しく作成した特徴量(shadow features)の値をランダムに入れ替えて適当な(目的変数と関係のない)特徴量にする。
- 全部の特徴量を合わせてRandom forestや勾配ブースティングなどで分類を行い、各特徴量の変数重要度を取得する。
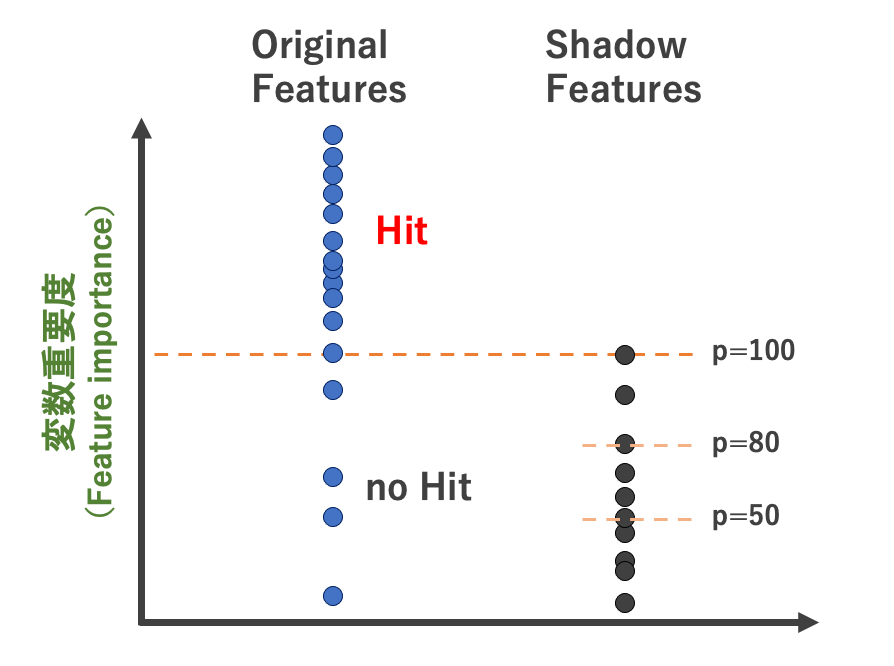
- オリジナルの特徴量の変数重要度が Shadow featuresの変数重要度よりも大きければそれをカウントし(hitとし)、再度学習を行う。 (正確にはShadow features の変数重要度の上位p%。後述)
- 1~4を繰り返し、統計的に有意な特徴量をのみを選択する。 (両側検定でオリジナルの説明変数がshadow featuresと比較して重要か判定する)
pパーセンタイルについて
pパーセンタイル:shadow features の変数重要度の何%を基準にするかの指標。 例えば、p=100にすると、shadow features のうち最も高い変数重要度を基準にhit判定する(下図参照) p=100の場合のhit判定イメージpパーセンタイルの設定方法
以下は金子研究室HPより。p=100 とすると説明変数が削除されすぎてモデルの推定性能が低下することがある。(特に、サンプルが少ない時には目的変数と関係性があるshadow features がたまたま生成することもある)
上記を考慮して、以下の手順で p を設定するのがベターとのこと。
変数をランダムに並び替えて、目的変数と相関係数を計算することを 10000回ほど行い、その相関係数の絶対値の最大値を $r_{ccmax}$ とした時に下式から $p$ を算出する。
$$ p = 100 \times ( 1 - r_{ccmax}) $$
pythonでの実装
1290化合物の水溶解度のデータを使って、Borutaによる変数選択ありと変数選択なしで予測精度に差が出るか検証する。 (変数選択なしで水溶解度を予測した記事はこちら)準備
データの取得
金子研究室HPよりデータを取得モジュールのインストール
boruta、RDkit(記述子作成に使用)、DCEkit(金子研モジュール|前処理に使用)をインストールしておく
conda install -c conda-forge rdkit
pip install dcekit
pip install borutapy
解析諸条件
- 記述子:RDkit記述子を使用 (ただし、変数重要度が著しく高いMolLogPは除いた)
- 前処理:分散が0の変数削除など基本的なもののみ。(詳細はコード参照)
- テストデータの割合(0.5)
コード
モジュールインポート〜データの準備
import os
import pandas as pd
import numpy as np
import math
import matplotlib.figure as figure
import matplotlib.pyplot as plt
from rdkit import Chem
from rdkit.ML.Descriptors import MoleculeDescriptors
from rdkit.Chem import AllChem
from sklearn.preprocessing import StandardScaler
from sklearn.ensemble import RandomForestRegressor as rf
from sklearn.model_selection import train_test_split,GridSearchCV
from sklearn.metrics import r2_score, mean_absolute_error,mean_squared_error
from dcekit.variable_selection import search_high_rate_of_same_values, search_highly_correlated_variables
from boruta import BorutaPy

# データの読み込み
suppl = Chem.SDMolSupplier('logSdataset1290_2d.sdf')
mols = [mol for mol in suppl if mol is not None]

# RDkit記述子の計算
descriptor_names = [descriptor_name[0] for descriptor_name in Chem.Descriptors._descList]
descriptor_calculation = MoleculeDescriptors.MolecularDescriptorCalculator(descriptor_names)
RDkit = [descriptor_calculation.CalcDescriptors(mol) for mol in mols]
df = pd.DataFrame(RDkit, columns = descriptor_names)
df.drop('MolLogP',axis=1,inplace=True)

# 溶解度(logS)の値を取得
df['logS'] =  [mol.GetProp('logS') if 'logS' in mol.GetPropNames() else 'None' for mol in mols]

# ここから変数選択
df = df.astype(float)

# 欠損のある変数を削除
df.dropna(axis=1,inplace=True)

# 分散が0の変数削除
del_num1 = np.where(df.var() == 0)
df = df.drop(df.columns[del_num1], axis=1)

# 変数選択(互いに相関関係にある変数の内一方を削除)
threshold_of_r = 0.95 #変数選択するときの相関係数の絶対値の閾値
corr_var = search_highly_correlated_variables(df, threshold_of_r)
df.drop(df.columns[corr_var], axis=1, inplace=True)

# 同じ値を多くもつ変数の削除
inner_fold_number = 2 #CVでの分割数(予定)
rate_of_same_value = []
threshold_of_rate_of_same_value = (inner_fold_number-1)/inner_fold_number
for col in df.columns:
	same_value_number = df[col].value_counts()
	rate_of_same_value.append(float(same_value_number[same_value_number.index[0]] / df.shape[0]))
del_var_num = np.where(np.array(rate_of_same_value) >= threshold_of_rate_of_same_value)
df.drop(df.columns[del_var_num], axis=1, inplace=True)
print(df.shape)
# => (1290, 64)
64個の特徴量が残った。次にこれらの特徴量をさらにborutaで絞り込む。
データの分割〜borutaによる変数選択
# 訓練・テストデータの分割と標準化
df_X = df.drop(['logS'],axis=1)
df_y = df.loc[:,['logS']]
X = df_X.values
y = df_y.values
X_train, X_test, y_train, y_test = train_test_split(X, y, test_size=0.5, random_state=0)

# StandardScalerを使って標準化
scaler_X = StandardScaler()
scaler_y = StandardScaler()
scaled_X_train = scaler_X.fit_transform(X_train)
scaled_y_train = scaler_y.fit_transform(y_train)
scaled_X_test = scaler_X.transform(X_test)
scaled_y_test = scaler_y.transform(y_test)

# Borutaによる変数選択
# pパーセンタイルの最適化(金子研の方法)
corr_list = []
for n in range(10000):
	shadow_features = np.random.rand(scaled_X_train.shape[0]).T
	corr = np.corrcoef(scaled_X_train, shadow_features,rowvar=False)[-1]
	corr = abs(corr[corr < 0.95])
	corr_list.append(corr.max())

corr_array = np.array(corr_list)
perc = 100 * (1-corr_array.max())

# Borutaの実施
feat_selector = BorutaPy(rf(),
n_estimators='auto',  # 特徴量の数に比例して、木の本数を増やす
verbose=0,
alpha=0.05, # 有意水準
max_iter=100, # 試行回数
perc = perc, #ランダム生成変数の重要度の何%を基準とするか
random_state=0
)
feat_selector.fit(scaled_X_train, scaled_y_train)
scaled_X_train_br = scaled_X_train[:,feat_selector.support_]
scaled_X_test_br = scaled_X_test[:,feat_selector.support_]
print('pパーセンタイル:',round(perc,2))
print('boruta後の変数の数:',scaled_X_train_br.shape[1])
"""output
pパーセンタイル:80.79
boruta後の変数の数: 43
"""
borutaによる変数選択で変数が64から47個まで絞り込まれた。
予測と精度検証
borutaによる変数選択ありの場合と、なしの場合両方でそれぞれ予測を行い、精度を比較する。model = rf()
model_br = rf()
model.fit(scaled_X_train, scaled_y_train)
model_br.fit(scaled_X_train_br, scaled_y_train)
scaled_pred_y_br = np.ndarray.flatten(model_br.predict(scaled_X_test_br))
pred_y_br = scaler_y.inverse_transform(scaled_pred_y_br)
scaled_pred_y = np.ndarray.flatten(model.predict(scaled_X_test))
pred_y = scaler_y.inverse_transform(scaled_pred_y)
print('r2_br:{}'.format(round(r2_score(y_test, pred_y_test_br),3)))
print('RMSE_br:{}'.format(round(np.sqrt(mean_squared_error(y_test, pred_y_test_br)),3)))
print('r2:{}'.format(round(r2_score(y_test, pred_y_test),3)))
print('RMSE:{}'.format(round(np.sqrt(mean_squared_error(y_test, pred_y_test)),3)))
"""output
r2_br:0.883
RMSE_br:0.697
r2:0.883
RMSE:0.699
結果まとめ
| r2 | RMSE | |
|---|---|---|
| borutaで変数選択 | 0.883 | 0.697 |
| 変数選択なし | 0.883 | 0. 699 |
