動機
Pythonによる機械学習
の第2章で紹介されている、教師あり学習クラス分類アルゴリズムを実際に試してみたかったので投稿。
とりあえず動けば良いやの精神で書いているので、コードが汚い点は無視してください!(^^)!
今回実行してみた教師あり学習アルゴリズムの一覧
書籍本文より抜粋。
1. 最近傍法
小さいデータに関しては、良いベースラインとなる。説明が容易。
2. 線形モデル
最初に試してみるべき、アルゴリズム。非常に大きいデータセット、非常に高次元のデータセットに適する。
3. ナイーブベイズ
クラス分類にしか使えない。線形モデルより更に高速。非常に大きいデータセット、高次元データ
に適する。線形モデルより精度が劣ることが多い。
4. 決定木
非常に高速。データのスケールを考慮する必要がない。可視化が可能で説明しやすい。
5. ランダムフォレスト
ほとんどの場合単一の決定木より高速で、頑健で、強力。データのスケールを考慮する必要が
ない。高次元の疎なデータには適さない。
6. 勾配ブースティング決定木
多くの場合、ランダムフォレストより少し精度が高い。ランダムフォレストより訓練に時間がかかるが、予測はこちらの方が早く、メモリ使用量も小さい。ランダムフォレストよりもパラメータに敏感。
7. サポートベクタマシン
同じように意味を持つ特徴量からなる中規模データセットに対しては強力。データのスケールを考慮する必要がある。パラメータに敏感。
8. ニューラルネットワーク
非常に複雑なモデルを構築できる。特に大きなデータセットに有効。データのスケールを調整する必要がある。パラメータに敏感。大きいモデルは訓練に時間がかかる。
データセットの準備
scikit-learnのirisデータセット
アイリスの花の、花弁の長さと幅、ガクの長さと幅を特徴量に、3種の花の種類を教師ラベルとして持つ、150行のデータです。
### 必要なライブラリのインポート
import numpy as np
import matplotlib.pyplot as plt
import pandas as pd
import mglearn as mg
from sklearn.model_selection import train_test_split
from sklearn.tree import export_graphviz
%matplotlib inline

### irisデータセットのインポート
from sklearn.datasets import load_iris
iris = load_iris()

### pandasのデータフレームに変換
iris_features_dataframe = pd.DataFrame(iris.data,columns = iris.feature_names)

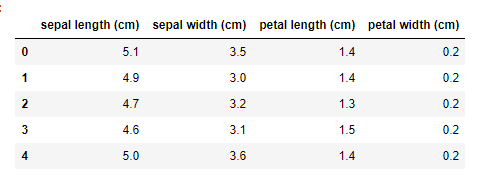
### 行頭から5行を表示
iris_features_dataframe.head()
### データを訓練セットとテストセットに分割する
X_train,X_test,y_train,y_test =train_test_split(iris.data,iris.target,random_state=0)

### データフレームから、scatter matrixを作成し、y_trainに従って色をつける
iris_features_dataframe = pd.DataFrame(X_train,columns = iris.feature_names)
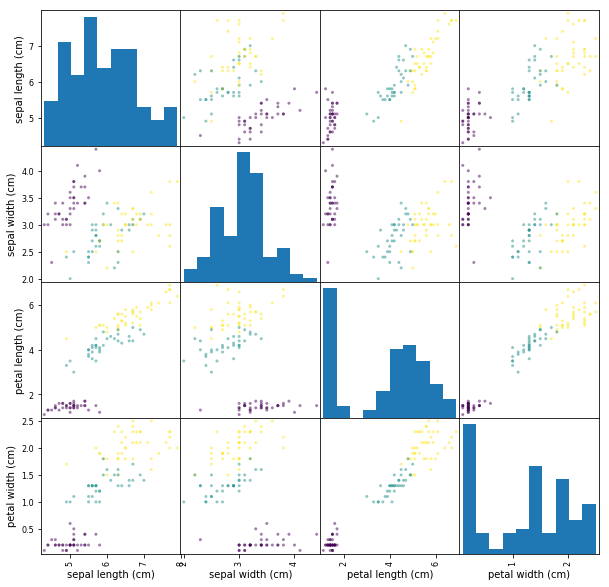
grr = pd.scatter_matrix(iris_features_dataframe,c=y_train,figsize =(10,10))
出力:

各特徴量をペアプロットしてみると、綺麗に分類されているので各アルゴリズムも上手く機能しそうです。
scikit-learnのbreast_cancerデータセット
がん検診患者の診断情報30個を特徴量に、対象患者がガンであるか否かを教師ラベルとして持つデータです。
### breast_cancerデータセットのインポート
from sklearn.datasets import load_breast_cancer
cancer = load_breast_cancer()

### pandasのデータフレームに変換
cancer_features_dataframe = pd.DataFrame(cancer.data,columns = cancer.feature_names)

### 行頭から5行を表示
cancer_features_dataframe.head()
これらのデータセットに対して、分類アルゴリズムを適用していきます。
分類アルゴリズムを適用する - ①インスタンスの生成
まずは、分類アルゴリズムのインスタンスを初期化パラメータと共に生成。alg配列に入れる。
### 1.K最近傍-アルゴリズム読み込み
from sklearn.neighbors import KNeighborsClassifier
clf = KNeighborsClassifier(n_neighbors=3)
algs.append(clf)

#### 2. ロジスティック回帰
from sklearn.linear_model import LogisticRegression
clf = LogisticRegression()
algs.append(clf)

#### 3. 決定木
from sklearn.tree import DecisionTreeClassifier
clf = DecisionTreeClassifier()
algs.append(clf)


#### 4. ランダムフォレスト
from sklearn.ensemble import RandomForestClassifier
clf = RandomForestClassifier()
algs.append(clf)


### 5. 勾配ブースティング決定木
from sklearn.ensemble import GradientBoostingClassifier
clf = GradientBoostingClassifier(random_state=0)
algs.append(clf)

#### 6. サポートベクタマシン
from sklearn.svm import LinearSVC
clf = LinearSVC()
algs.append(clf)

#### 7. ニューラルネットワーク
from sklearn.neural_network import MLPClassifier
clf = MLPClassifier()
algs.append(clf)

#### 配列に格納した識別子を表示する
algs

#### 出力結果
[KNeighborsClassifier(algorithm='auto', leaf_size=30, metric='minkowski',
            metric_params=None, n_jobs=1, n_neighbors=3, p=2,
            weights='uniform'),
 LogisticRegression(C=1.0, class_weight=None, dual=False, fit_intercept=True,
           intercept_scaling=1, max_iter=100, multi_class='ovr', n_jobs=1,
           penalty='l2', random_state=None, solver='liblinear', tol=0.0001,
           verbose=0, warm_start=False),
 DecisionTreeClassifier(class_weight=None, criterion='gini', max_depth=None,
             max_features=None, max_leaf_nodes=None,
             min_impurity_split=1e-07, min_samples_leaf=1,
             min_samples_split=2, min_weight_fraction_leaf=0.0,
             presort=False, random_state=None, splitter='best'),
 RandomForestClassifier(bootstrap=True, class_weight=None, criterion='gini',
             max_depth=None, max_features='auto', max_leaf_nodes=None,
             min_impurity_split=1e-07, min_samples_leaf=1,
             min_samples_split=2, min_weight_fraction_leaf=0.0,
             n_estimators=10, n_jobs=1, oob_score=False, random_state=None,
             verbose=0, warm_start=False),
 GradientBoostingClassifier(criterion='friedman_mse', init=None,
               learning_rate=0.1, loss='deviance', max_depth=3,
               max_features=None, max_leaf_nodes=None,
               min_impurity_split=1e-07, min_samples_leaf=1,
               min_samples_split=2, min_weight_fraction_leaf=0.0,
               n_estimators=100, presort='auto', random_state=0,
               subsample=1.0, verbose=0, warm_start=False),
 LinearSVC(C=1.0, class_weight=None, dual=True, fit_intercept=True,
      intercept_scaling=1, loss='squared_hinge', max_iter=1000,
      multi_class='ovr', penalty='l2', random_state=None, tol=0.0001,
      verbose=0),
 MLPClassifier(activation='relu', alpha=0.0001, batch_size='auto', beta_1=0.9,
        beta_2=0.999, early_stopping=False, epsilon=1e-08,
        hidden_layer_sizes=(100,), learning_rate='constant',
        learning_rate_init=0.001, max_iter=200, momentum=0.9,
        nesterovs_momentum=True, power_t=0.5, random_state=None,
        shuffle=True, solver='adam', tol=0.0001, validation_fraction=0.1,
        verbose=False, warm_start=False)]
分類アルゴリズムを適用する - ②実行関数を呼び出す
### 訓練データとテストデータの結果を格納する配列を生成
training_score_i = []
test_score_i = []
training_score_c = []
test_score_c = []

### algs配列から各種識別器インスタンスを取り出し学習&TEST!
  for alg in algs:
      ##irisデータセットに学習&テスト
      tr_alg_i = alg.fit(X_train_i,y_train_i)
      training_score_i.append(tr_alg_i.score(X_train_i,y_train_i))
      test_score_i.append(tr_alg_i.score(X_test_i,y_test_i))

      ##cancerデータセットに学習&テスト
      tr_alg_c = alg.fit(X_train_c,y_train_c)
      training_score_c.append(tr_alg_c.score(X_train_c,y_train_c))
      test_score_c.append(tr_alg_c.score(X_test_c,y_test_c))
結果
algo_names = ["k","logi","tree","rand_tree","grad_tree","svm","nnw"]
fig,axes = plt.subplots(2,2,figsize=(30,10))
## 訓練データの描画
axes[0][0].bar([1,2,3,4,5,6,7],training_score_i,tick_label=algo_names,color="r")
axes[0][0].set_xlabel('algo_type')
axes[0][0].set_ylabel('precision_rate')
axes[0][0].set_title("iris_training_data")
axes[0][1].bar([1,2,3,4,5,6,7],training_score_c,tick_label=algo_names)
axes[0][1].set_xlabel('algo_type')
axes[0][1].set_ylabel('precision_rate')
axes[0][1].set_title("cancer_training_data")

## テストデータの描画
axes[1][0].bar([1,2,3,4,5,6,7],test_score_i,tick_label=algo_names,color="r")
axes[1][0].set_xlabel('algo_type')
axes[1][0].set_ylabel('precision_rate')
axes[1][0].set_title("iris_test_data")
axes[1][1].bar([1,2,3,4,5,6,7],test_score_c,tick_label=algo_names)
axes[1][1].set_xlabel('algo_type')
axes[1][1].set_ylabel('precision_rate')
axes[1][1].set_title("cancer_test_data")
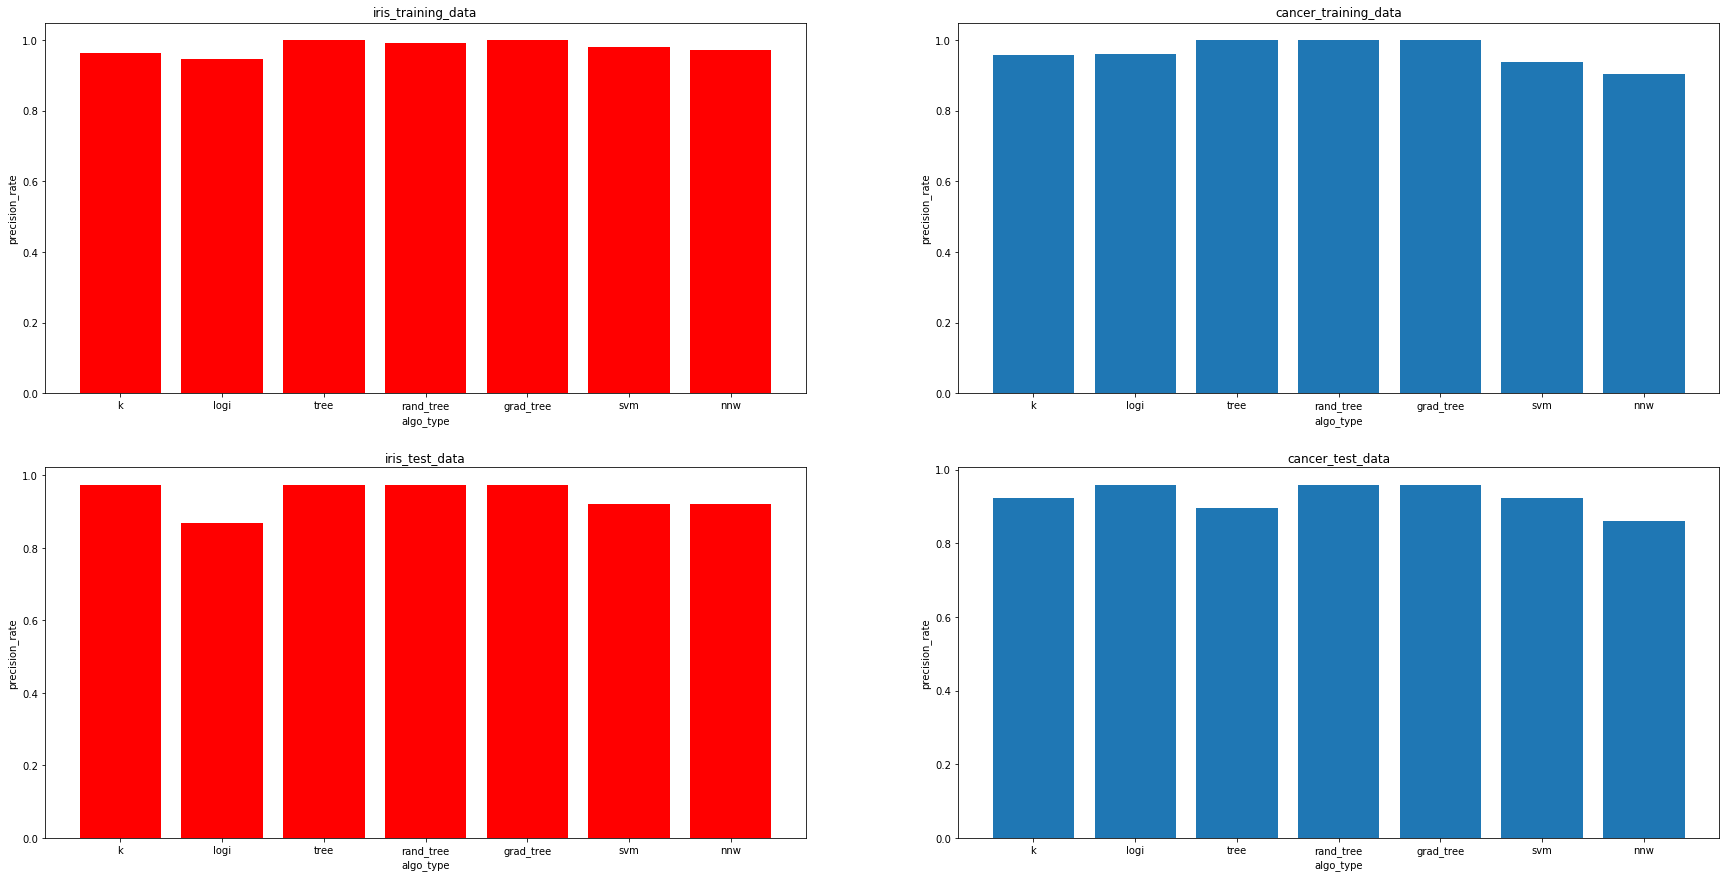
出力グラフ
赤色 => iris 青色 => cancer
上 => 訓練データ 下 => テストデータ
横軸->アルゴリズムの種類 縦軸 => 正解率
左から、["k(K-最近傍)","logi(ロジスティック回帰)","tree(決定木)","rand_tree(ランダムフォレスト)","grad_tree(勾配ブースティング決定木)","svm(サポートベクタマシン)","nnw(ニューラルネットワーク)"]

感想
- パラメータ調整・データの前処理を一切していない状態だと、やはり決定木ベースのアルゴリズムが強い。
- ニューラルネットワークとSVMはデータの前処理が必須と本に書いてあったので、標準化するとまた違う結果になったかも。
以上です。

