#透明度を維持したまま描画したい
<canvas class="canC" id="canV" width=500 height=600></canvas>

<style>
    .canC { width:500px;  height:600px;}
</style>

<script>
//--  Canvasとマウスイベントのセットアップ
var canvas = document.getElementById("canV");
var ctx = canvas.getContext("2d");
var w = canvas.width;
var h = canvas.height;
var mouse = {
    x:0,
    y:0,
    buttonLastRaw:0, // user modified value
    buttonRaw:0,
    over:false,
};
function mouseMove(event){
    mouse.x = event.offsetX;  mouse.y = event.offsetY;
    if(mouse.x === undefined){ mouse.x = event.clientX;  mouse.y = event.clientY;}
    if(event.type === "mousedown"){
        mouse.buttonRaw = 1;
    }
    else if(event.type === "mouseup"){
        mouse.buttonRaw = 0;
    }
    else if(event.type === "mouseout"){
        mouse.buttonRaw = 0;
        mouse.over = false;
    }
    else if(event.type === "mouseover"){
        mouse.over = true;
    }
    event.preventDefault();
}

canvas.addEventListener('mousemove',mouseMove);
canvas.addEventListener('mousedown',mouseMove);
canvas.addEventListener('mouseup'  ,mouseMove);
canvas.addEventListener('mouseout'  ,mouseMove);
canvas.addEventListener('mouseover'  ,mouseMove);
canvas.addEventListener("contextmenu", (e) => {
    canvas.preventDefault();
});

// 描画するレイヤーを作成
var layer1 = document.createElement("canvas");
layer1.width = w;   //キャンバスと同じサイズを指定
layer1.height = h;
layer1.ctx = layer1.getContext("2d");
//レイヤーの設定
layer1.ctx.lineCap = "round";
layer1.ctx.lineJoin = "round";
layer1.ctx.lineWidth = 16;
layer1.ctx.globalAlpha = 1;  // このレイヤーにアルファを1に設定して描画;

// 色のセットアップ
let current_color = "#000000";

// update on animation frame
function update(){
    ctx.clearRect(0,0,w,h);  // キャンバスクリア
    var c = layer1.ctx;      // 描画レイヤー定義
    if(mouse.buttonRaw){    // EventがTrueなら描画
        if(mouse.lastx === undefined){   // 始点がない場合、今の位置をセット
            mouse.lastx = mouse.x;
            mouse.lasty = mouse.y;
	        c.strokeStyle = current_color;
            instructions = false;
            ctx.globalAlpha = 0.6; // 透明度の設定
        }
        //描画するのは作成したレイヤー
        c.beginPath();
        c.moveTo(mouse.lastx,mouse.lasty);
        c.lineTo(mouse.x,mouse.y);
        c.stroke();
        mouse.lastx = mouse.x;
        mouse.lasty = mouse.y;
    }else{  // EventがFalseなら初期化
        mouse.lastx = undefined;
        ctx.fillStyle = current_color;
        ctx.globalAlpha = 0.6;
        ctx.beginPath();
        ctx.arc(mouse.x,mouse.y,8,0,Math.PI*2);
        ctx.fill();
    }

    //レイヤーをキャンバスに描画
    ctx.drawImage(layer1,0,0);
    requestAnimationFrame(update);  // do it all again.
}
//マウスの始点を取得
mouse.lastx;
mouse.lasty;

update()
</script>
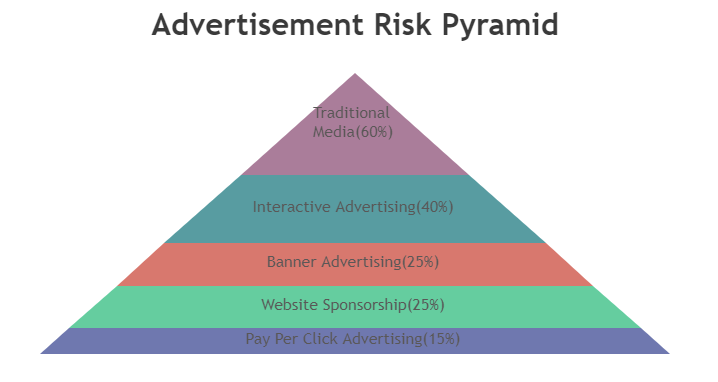
#pyramid型のグラフを描く
<script>
window.onload = function () {

var chart = new CanvasJS.Chart("chartContainer", {
	animationEnabled: true,
	exportEnabled: true,
	theme: "light2",
	title:{
		text: "Advertisement Risk Pyramid"
	},
	data: [{
		type: "pyramid",
		toolTipContent: "<b>{label}</b>: {y}%",
		indexLabelFontColor: "#5A5757",
		indexLabelFontSize: 16,
		indexLabel: "{label}({y}%)",
		indexLabelPlacement: "inside",
		dataPoints: [
			{ y: 15, label: "Pay Per Click Advertising" },
			{ y: 25, label: "Website Sponsorship" },
			{ y: 25, label: "Banner Advertising" },
			{ y: 40, label: "Interactive Advertising" },
			{ y: 60, label: "Traditional Media" }
		]
	}]
});
chart.render();

}
</script>
