100
96

Delete article

Deleted articles cannot be recovered.

Draft of this article would be also deleted.

Are you sure you want to delete this article?

More than 5 years have passed since last update.

Python 3:3次元グラフの書き方(matplotlib, pyplot, mplot3d, MPL)

Last updated at Posted at 2018-01-17

3次元のグラフの書き方

ニューラルネットワークの学習で現れる,偏微分(勾配)の理解のため3次元グラフを描いてみる.(参考:数値微分)

######Pythonで,NumPyとmatplotlibを使って3次元グラフを描く

準備

  • 3次元なのでmpl_toolkits.mplot3dなどをインポート
ex1-1.py
from mpl_toolkits.mplot3d import Axes3D
import matplotlib.pyplot as plt
import numpy as np
  • 引数の2乗和を計算する関数を例として考える
ex1-2.py
def func1(x, y):
    return x**2 + y**2
  • 描写データの作成
    • 3次元で描写するには2次元メッシュが必要
    • 2次元配列をarangeを用いて作る
    • x, y をそれぞれ1次元領域で分割する
ex1-3.py
x = np.arange(-3.0, 3.0, 0.1)
y = np.arange(-3.0, 3.0, 0.1)
  • 2次元メッシュはmeshgridでつくる
    • Xの行にxの行列を,Yは列にyの配列を入れたものになっている
ex1-3.py
X, Y = np.meshgrid(x, y)
Z = func1(X, Y)
  • グラフの作成
    • figureで2次元の図を生成する
    • その後,Axes3D関数で3次元にする
ex1-4.py
fig = plt.figure()
ax = Axes3D(fig)
  • 軸ラベルの設定
ex1-5.py
ax.set_xlabel("x")
ax.set_ylabel("y")
ax.set_zlabel("f(x, y)")

-グラフ描写

ex1-6.py
ax.plot_wireframe(X, Y, Z)
plt.show()
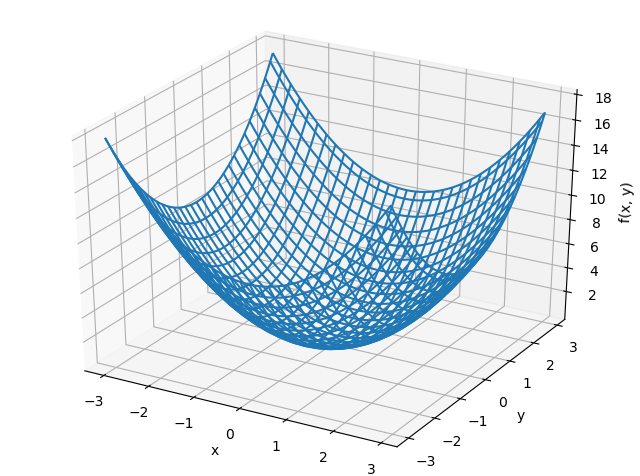
以上をまとめて実装すれば,以下のような3次元のグラフが描画されます.


ex1.png


plotのプロパティとして,color(線の色),linestyle(線の種類),マーカーの種類などが変更できる.

もっと簡単に描けるコードなどありましたらご教授ください.
詳細は後ほど追加する予定です.

100
96
0

Register as a new user and use Qiita more conveniently

  1. You get articles that match your needs
  2. You can efficiently read back useful information
  3. You can use dark theme
What you can do with signing up
100
96

Delete article

Deleted articles cannot be recovered.

Draft of this article would be also deleted.

Are you sure you want to delete this article?