以前の記事(下記)のアップデート版となります。本記事では OCI CLI と シェルスクリプト でファイルシステム使用率をカスタム・メトリックとして取得してみますやで。
彡(゚)(゚)
0. IMDS = インスタンス・メタデータ・サービス
IMDS = インスタンス・メタデータ・サービスとは OCI Compute で利用可能なインスタンスの詳細情報を取得できるサービスとなります。
以前の記事では v1 のエンドポイントから情報を取得していましたが、本記事ではセキュリティが強化された v2 から取得するように改修しています。
1. OCI CLI のインストール
本記事では詳細は省きます。OCI CLI のインストール方法は幾つかありますが、下記マニュアルの dnfコマンド でインストールしました。
クイックスタート - CLIのインストール - Oracle Linux 8
https://docs.oracle.com/ja-jp/iaas/Content/API/SDKDocs/cliinstall.htm#InstallingCLI__oraclelinux8
sudo dnf -y install oraclelinux-developer-release-el8
sudo dnf install python36-oci-cli
2. OCI CLI のポリシー(実行権限付与)
本記事では詳細は省きます。OCI CLI の実行権限付与はインスタンス・プリンシパルで実施しました。
下記の動的グループとポリシー(実行権限付与)を行っています。
-- 動的グループ ayu-dynamic-group02
All {instance.compartment.id = 'ocid1.compartment.oc1..xxxxxxxx'}
-- ポリシー ayu-policy-custommetric
Allow dynamic-group ayu-dynamic-group02 to manage metrics in compartment ayu-compartment01
下記マニュアルも参照して下さい。
インスタンスからのサービスのコール
https://docs.oracle.com/ja-jp/iaas/Content/Identity/Tasks/callingservicesfrominstances.htm
3. シェルスクリプトの配置
opcユーザー(※)のホームディレクトリ配下にディレクトリを作成してスクリプトを配置します。今回は scripts というディレクトリを作成しました。
※今回は opcユーザーを選択していますが OCI CLI を実行できれば OSユーザーは何でも良いです。
cd
mkdir scripts
cd scripts
(scp や vi 等でファイルを配置)
スクリプトは以下の通りです。GitHubにもアップロードしました。
#!/usr/bin/bash

# ---
# This script uploads Linux file system usage as OCI custom metric by the OCI CLI.
# It must be able to run the OCI CLI beforehand.
# Targets xfs and ext4. It's excluded for nfs etc and /boot.
# Please edit in this shell environment variables. PATH, workfile, jsonfile, etc.
# ---
# Usage Example ... $ ./OCIFileSystemUsage.sh
# Parameters    ... Not required
# Return Code
#   0 ... Successful completion.
#   1 ... abend.
# ---

# Initialize
LANG=en_US.UTF-8
PATH=/home/opc/bin:/home/opc/.local/bin:/home/opc/bin:/usr/share/Modules/bin:/usr/local/bin:/usr/bin:/usr/local/sbin:/usr/sbin
mypath=$(dirname "${0}")
cliLocation="/usr/bin/oci"
workfile="${mypath}/filesystemusage_work.txt"
jsonfile="${mypath}/filesystemusage_work.json"

# OCI env initialize
compartmentId=$(curl -s -H "Authorization: Bearer Oracle" -L http://169.254.169.254/opc/v2/instance/ | jq -r '.compartmentId')
metricNamespace="compute_filesystem_usage"
metricResourceGroup="compute_filesystem_usage_rg"
instanceName=$(curl -s -H "Authorization: Bearer Oracle" -L http://169.254.169.254/opc/v2/instance/ | jq -r '.displayName')
instanceId=$(curl -s -H "Authorization: Bearer Oracle" -L http://169.254.169.254/opc/v2/instance/ | jq -r '.id')
endpointRegion=$(curl -s -H "Authorization: Bearer Oracle" -L http://169.254.169.254/opc/v2/instance/ | jq -r '.canonicalRegionName')
Timestamp=$(date -u '+%Y-%m-%dT%H:%M:%SZ')

# Upload custom metric function
# $1...mountPoint
# $2...Usage
function UploadCustomMetric () {
  metricsJson=$(cat << EOF > ${jsonfile}
[
   {
      "namespace":"${metricNamespace}",
      "compartmentId":"${compartmentId}",
      "resourceGroup":"${metricResourceGroup}",
      "name":"FileSystemUsage",
      "dimensions":{
         "mountPoint":"$1",
         "instanceName":"${instanceName}"
      },
      "metadata":{
         "unit":"Percent",
         "displayName":"FilesystemUsage"
      },
      "datapoints":[
         {
            "timestamp":"${Timestamp}",
            "value":"$2"
         }
      ]
   }
]
EOF
  )
  # for debug.
  cat ${jsonfile};
  echo ${cliLocation} monitoring metric-data post --metric-data file://${jsonfile} --endpoint https://telemetry-ingestion.${endpointRegion}.oraclecloud.com --auth instance_principal
  # Upload custom metric by the OCI CLI.
  ${cliLocation} monitoring metric-data post --metric-data file://${jsonfile} --endpoint https://telemetry-ingestion.${endpointRegion}.oraclecloud.com --auth instance_principal
}

# Output filesystem information to workfile, xfs or ext4 only, exclude header.
Timestamp=$(date -u '+%Y-%m-%dT%H:%M:%SZ')
df --type=xfs --type=ext4 | grep -Ev "^Filesystem" > ${workfile}
if [ $? -eq 0 ]
then
  echo "no error df.";
else
  #If error occured, dummy metric upload.
  UploadCustomMetric error -1;
  # abend.
  echo "error in df.";
  exit 1;
fi

# Upload custom metric per mountPoint.
IFS=$'\n'
for line in $(cat ${workfile})
do
  Usage=$(echo $line | awk '{print $5}' | sed 's/%//')
  mountPoint=$(echo $line | awk '{print $6}')
  # for debug.
  echo ${Usage}
  echo ${mountPoint}
  # Call upload custom metric function.
  UploadCustomMetric "${mountPoint}" "${Usage}"
done

# Successful completion.
exit 0;
dfコマンドで取得したマウント・ポイントと使用率をJSONに加工して OCI CLI でアップロードしています。
xfs と ext4 を対象としています。nfs等は含んでいません。
4. シェルスクリプトの動作確認
シェルスクリプトに実行権限を付与して動作確認します。
chmod 750 OCIFileSystemUsage.sh
./OCIFileSystemUsage.sh
実行結果のサンプルは以下の通りとなります。
[opc@ays-prv-compute02 scripts]$ ./OCIFileSystemUsage.sh
no error df.
57
/
[
   {
      "namespace":"compute_filesystem_usage",
      "compartmentId":"ocid1.compartment.oc1..aaaaaaaadp65g6t2agwkvlhc2mshui7zjcjk4d6bmp6f542bwlddezmu4eva",
      "resourceGroup":"compute_filesystem_usage_rg",
      "name":"FileSystemUsage",
      "dimensions":{
         "mountPoint":"/",
         "instanceName":"ays-prv-compute02"
      },
      "metadata":{
         "unit":"Percent",
         "displayName":"FilesystemUsage"
      },
      "datapoints":[
         {
            "timestamp":"2025-07-30T17:01:56Z",
            "value":"57"
         }
      ]
   }
]
/usr/bin/oci monitoring metric-data post --metric-data file://./filesystemusage_work.json --endpoint https://telemetry-ingestion.us-phoenix-1.oraclecloud.com --auth instance_principal
{
  "data": {
    "failed-metrics": [],
    "failed-metrics-count": 0
  }
}
2
/var/oled
[
   {
      "namespace":"compute_filesystem_usage",
      "compartmentId":"ocid1.compartment.oc1..aaaaaaaadp65g6t2agwkvlhc2mshui7zjcjk4d6bmp6f542bwlddezmu4eva",
      "resourceGroup":"compute_filesystem_usage_rg",
      "name":"FileSystemUsage",
      "dimensions":{
         "mountPoint":"/var/oled",
         "instanceName":"ays-prv-compute02"
      },
      "metadata":{
         "unit":"Percent",
         "displayName":"FilesystemUsage"
      },
      "datapoints":[
         {
            "timestamp":"2025-07-30T17:01:56Z",
            "value":"2"
         }
      ]
   }
]
/usr/bin/oci monitoring metric-data post --metric-data file://./filesystemusage_work.json --endpoint https://telemetry-ingestion.us-phoenix-1.oraclecloud.com --auth instance_principal
{
  "data": {
    "failed-metrics": [],
    "failed-metrics-count": 0
  }
}
36
/boot
[
   {
      "namespace":"compute_filesystem_usage",
      "compartmentId":"ocid1.compartment.oc1..aaaaaaaadp65g6t2agwkvlhc2mshui7zjcjk4d6bmp6f542bwlddezmu4eva",
      "resourceGroup":"compute_filesystem_usage_rg",
      "name":"FileSystemUsage",
      "dimensions":{
         "mountPoint":"/boot",
         "instanceName":"ays-prv-compute02"
      },
      "metadata":{
         "unit":"Percent",
         "displayName":"FilesystemUsage"
      },
      "datapoints":[
         {
            "timestamp":"2025-07-30T17:01:56Z",
            "value":"36"
         }
      ]
   }
]
/usr/bin/oci monitoring metric-data post --metric-data file://./filesystemusage_work.json --endpoint https://telemetry-ingestion.us-phoenix-1.oraclecloud.com --auth instance_principal
{
  "data": {
    "failed-metrics": [],
    "failed-metrics-count": 0
  }
}
5. crontab による定期実行設定と実行結果確認
crontab で定期実行を設定します。下記を opcユーザー の crontab に設定して10分毎に実行しています。
0,5,10,15,20,25,30,35,40,45,50,55 * * * * /home/opc/scripts/OCIFileSystemUsage.sh > /home/opc/scripts/OCIFileSystemUsage.log 2>&1
定期実行が完了すると /home/opc/scripts配下に crontab の標準出力がリダイレクトされた結果が出力されています。
[opc@ays-prv-compute02 scripts]$ ls -la
total 20
drwxrwxr-x.  2 opc opc  130 Jul 30 16:50 .
drwx------. 14 opc opc 4096 Jul 30 16:38 ..
-rw-rw-r--.  1 opc opc  579 Jul 30 16:50 filesystemusage_work.json
-rw-rw-r--.  1 opc opc  201 Jul 30 16:50 filesystemusage_work.txt
-rw-r--r--.  1 opc opc 2603 Jul 30 16:50 OCIFileSystemUsage.log
-rwxr-x---.  1 opc opc 3207 Jul 30 16:38 OCIFileSystemUsage.sh
[opc@ays-prv-compute02 scripts]$
failed-metric-count が 0 であれば実行は成功しています。
[opc@ays-prv-compute02 scripts]$ grep failed-metrics OCIFileSystemUsage.log
    "failed-metrics": [],
    "failed-metrics-count": 0
    "failed-metrics": [],
    "failed-metrics-count": 0
    "failed-metrics": [],
    "failed-metrics-count": 0
[opc@ays-prv-compute02 scripts]$
6. メトリック・エクスプローラーによるカスタム・メトリックの確認
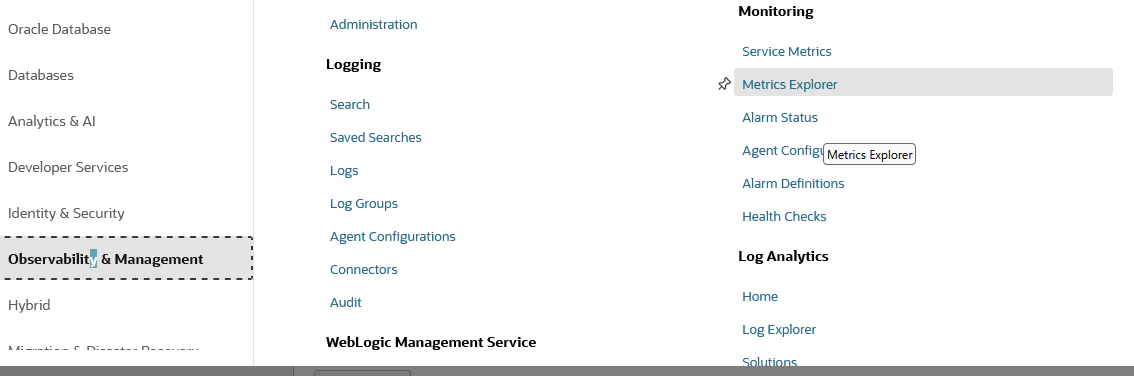
しばらくした後にOCIコンソールにログインしてカスタム・メトリックを確認します。画面左上のハンバーガーメニュー ⇒ Observability&Management ⇒ Monitoring ⇒ Metric Explorer でメトリック・エクスプローラーの画面に遷移します。
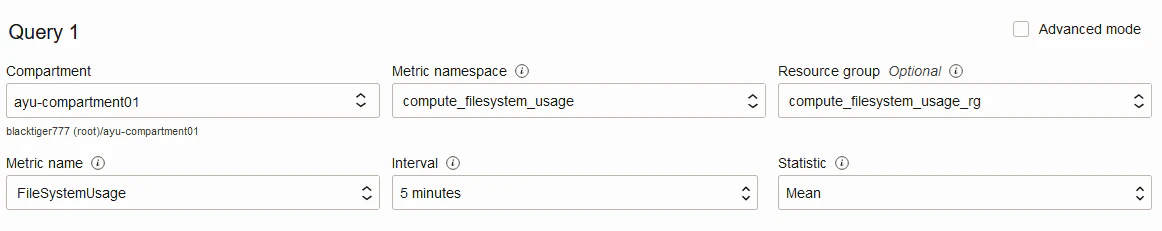
以下を選択して「Update Chart」ボタンをクリックします。
| 名前 | プルダウン |
|---|---|
| Metric Namespace | compute_filesystem_usage |
| Resource Group | compute_filesystem_usage_rg |
| Metric name | FileSystemUsage |
| Interval | 5 minutes |
結果は以下のようになります。
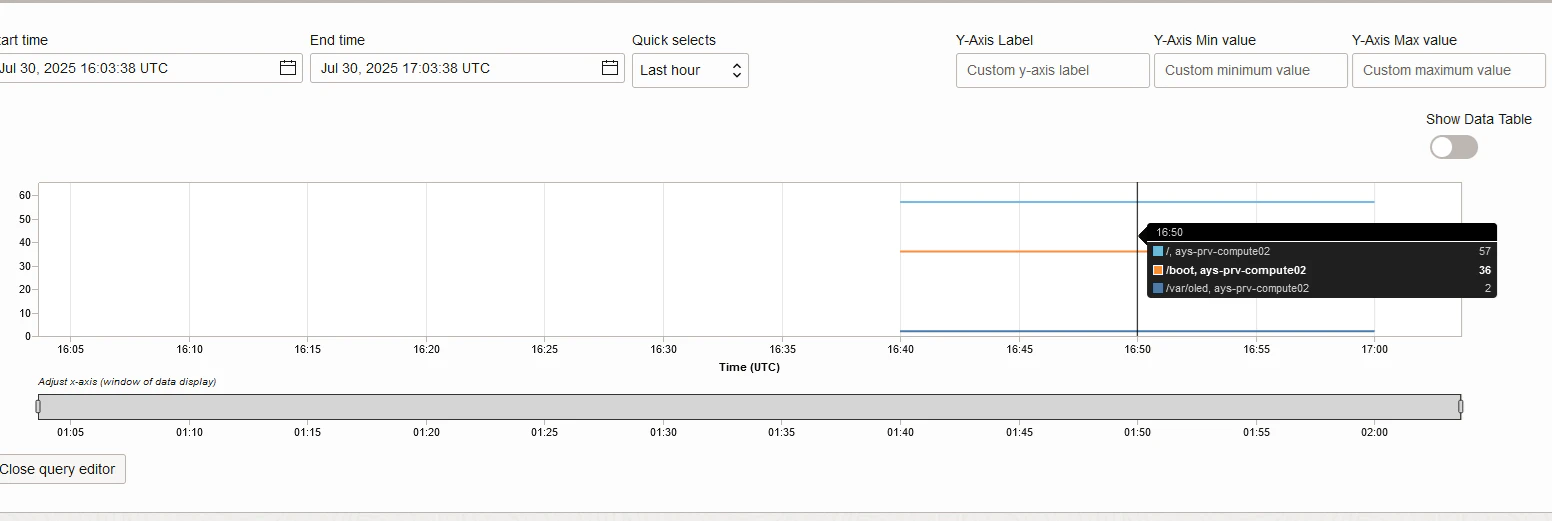
ファイルシステム使用率がメトリックとしてアップロードされている事が確認できました。
彡(^)(^)
7. まとめ
IMDSv2でも動作しました。セキュリティは重要ですやね彡(^)(^)