3. チュートリアルケースの動作確認
ここでは、olaFlow に付属しているチュートリアルケースの動作確認を行う。チュートリアルケースは、ダムブレイク (CR35_bambreak) を対象とする。
3.1 前処理
カレントディレクトリは計算実行ディレクトリであるものとして説明する。
3.1.1 ファイル構成
Allrun
Allrun
#!/bin/sh
cd "${0%/*}" || exit                                # Run from this directory
. ${WM_PROJECT_DIR:?}/bin/tools/RunFunctions        # Tutorial run functions
#------------------------------------------------------------------------------

restore0Dir

runApplication blockMesh

runApplication setFields

runApplication $(getApplication)

#runApplication decomposePar
#runParallel $(getApplication)
Allclean
Allclean
#!/bin/sh
cd "${0%/*}" || exit                                # Run from this directory
. ${WM_PROJECT_DIR:?}/bin/tools/CleanFunctions      # Tutorial clean functions
#------------------------------------------------------------------------------

cleanCase0
3.1.2 system ディレクトリ
blockMeshDict
blockMeshDict
scale 1;

minx 0;
maxx 0.89;
miny 0;
maxy 0.02;
minz 0;
maxz 0.58;

vertices
(
    ( $minx $miny $minz )
    ( $maxx $miny $minz )
    ( $maxx $maxy $minz )
    ( $minx $maxy $minz )
    ( $minx $miny $maxz )
    ( $maxx $miny $maxz )
    ( $maxx $maxy $maxz )
    ( $minx $maxy $maxz )
);

nx 178; // dx = 0.005
ny 1;
nz 116; // dz = 0.005

blocks
(
    hex (0 1 2 3 4 5 6 7) ($nx $ny $nz) simpleGrading (1 1 1)
);

edges
(
);

boundary
(
    leftWall
    {
        type wall;
        faces
        (
            (0 4 7 3)
        );
    }
    rightWall
    {
        type wall;
        faces
        (
            (1 5 6 2)
        );
    }
    lowerWall
    {
        type wall;
        faces
        (
            (0 1 2 3)
        );
    }
    atmosphere
    {
        type patch;
        faces
        (
            (4 5 6 7)
        );
    }
);

mergePatchPairs
(
);
controlDict
controlDict
application     olaFlow;

startFrom       latestTime;

startTime       0;

stopAt          endTime;

endTime         4;

deltaT          0.001;

writeControl    adjustableRunTime;

writeInterval   0.05;

purgeWrite      0;

writeFormat     ascii;

writePrecision  6;

compression     off;

timeFormat      general;

timePrecision   6;

runTimeModifiable yes;

adjustTimeStep  yes;

maxCo           0.5;
maxAlphaCo      0.5;

maxDeltaT       1;

functions
{
    freeSurface
    {
        type surfaces;
        libs
        (
            "libsampling.so"
        );
        writeControl   outputTime;
        interpolationScheme cellPoint;
        surfaceFormat  raw;
        fields
        (
        );
        surfaces
        (
            topFreeSurface
            {
                type        isoSurface;
                isoField    alpha.water;
                isoValue    0.5;
                interpolate true;
            }
        );
    }
}
decomposeParDict
decomposePardict
numberOfSubdomains 4;

method          simple;

simpleCoeffs
{
    n               ( 2 2 1 );
    delta           0.001;
}
fvSchmes
fvSchmes
ddtSchemes
{
    default         Euler;
}

gradSchemes
{
    default         Gauss linear;
}

divSchemes
{
    div(rhoPhi,U)  Gauss limitedLinearV 1;
    div((rhoPhi|interpolate(porosity)),U)  Gauss limitedLinearV 1;
    div(phi,alpha)  Gauss vanLeer;
    div(phirb,alpha) Gauss interfaceCompression;
    div((muEff*dev(T(grad(U))))) Gauss linear;
}

laplacianSchemes
{
    default         Gauss linear corrected;
}

interpolationSchemes
{
    default         linear;
}

snGradSchemes
{
    default         corrected;
}

fluxRequired
{
    default         no;
    p_rgh;
    pcorr;
    alpha.water;
}
fvSolution
※ MULESCorrは "no" とする。
fvSolution
solvers
{
    "alpha.water.*"
    {
        nAlphaCorr      1;
        nAlphaSubCycles 3;
        alphaOuterCorrectors yes;
        cAlpha          1;

        MULESCorr       no;
        nLimiterIter    3;

        solver          smoothSolver;
        smoother        symGaussSeidel;
        tolerance       1e-8;
        relTol          0;
    }

    "pcorr.*"
    {
        solver          PCG;
        preconditioner  DIC;
        tolerance       1e-5;
        relTol          0;
    }

    p_rgh
    {
        solver          PCG;
        preconditioner  DIC;
        tolerance       1e-07;
        relTol          0.05;
    }

    p_rghFinal
    {
        $p_rgh;
        relTol          0;
    }

    U
    {
        solver          smoothSolver;
        smoother        symGaussSeidel;
        tolerance       1e-06;
        relTol          0;
    }
}

PIMPLE
{
    momentumPredictor   no;
    nOuterCorrectors    1;
    nCorrectors         3;
    nNonOrthogonalCorrectors 0;
}

relaxationFactors
{
    fields
    {
    }
    equations
    {
        ".*" 1;
    }
}
setFieldsDict
※ porosityIndex の設定も行う。
setFieldsDict
defaultFieldValues
(
    volScalarFieldValue alpha.water 0
    volScalarFieldValue porosityIndex 0
);

regions
(
    boxToCell // Water reservoir
    {
        box (-1 -1 -1) (0.29 1 0.35);
        fieldValues
        (
            volScalarFieldValue alpha.water 1
        );
    }
    boxToCell // Water bottom level
    {
        box (-1 -1 -1) (1 1 0.025);
        fieldValues
        (
            volScalarFieldValue alpha.water 1
        );
    }

    boxToCell // Porous zone
    {
        box (0.30 -1 -1) (0.59 1 0.6);
        fieldValues
        (
            volScalarFieldValue porosityIndex 1
        );
    }
);
3.1.3 constant ディレクトリ
dynamicMeshDict
dynamicMeshDict
dynamicFvMesh staticFvMesh;
g
g
dimensions      [0 1 -2 0 0 0 0];
value           (0 0 -9.81);
porosityDict
※ 括弧の最初のデータが porosityIndex 0 で多孔質体以外の領域に適用され、次のデータが porosityIndex 1 で多孔質体の領域に適用される。
porosityDict
a               2(0 50);
b               2(0 2.0);
c               2(0 0.34);

D50             2(1 0.0159);
porosity        2(1 0.49);
transportProperties
transportProperties
phases          (water air);

water
{
    transportModel  Newtonian;
    nu              1e-06;
    rho             1000;
}

air
{
    transportModel  Newtonian;
    nu              1.48e-05;
    rho             1;
}

sigma            0.07;
turbulenceProperties
simulationType laminar;
3.1.4 labData
実験データ
3.2 計算実行
$ ./Allrun
3.3 後処理
python のードで計算結果を図示する。コードは次の通り。
plotValidation.py
※ オリジナルは pylab を使用していたが、matplotlib に書き換えた。
plotValidation.py
#!/usr/bin/python
import os
import matplotlib.pyplot as plt
# Sub-functions
def getNumData(fileName):
fileR = open(fileName, 'r')
data = fileR.read()
fileR.close()
data = data.split('\n')
data.pop(0) # Header
data.pop(0) # Header
while len(data[-1]) == 0:
data.pop() # Last line
xy = []
for line in data:
line = line.split(' ')
if(float(line[1]) > 0):
xy.append([float(line[0]), float(line[2])])
xy_sorted = sorted(xy)
x = [row[0] for row in xy_sorted]
y = [row[1] for row in xy_sorted]
return x, y
def getLabData(fileName):
fileR = open(fileName, 'r')
data = fileR.read()
fileR.close()
data = data.split('\n')
data.pop() # Last line
x = []
y = []
for line in data:
line = line.split(' ')
x.append(float(line[0]))
y.append(float(line[1]))
return x, y
# Definitions
times = ['0.00', '0.35', '0.75', '1.15', '1.55', '1.95'];
pathNum = './postProcessing/freeSurface';
fileNum = 'topFreeSurface.raw'
pathLab = './labData';
# Plot
fig, axes = plt.subplots(2, 3, sharey = "all", tight_layout=True, figsize=(9.6, 7.2))
ii = 0
jj = 0
for i in range(len(times)):
if(i >= 0 and i <= 2):
ii = 0
jj = i
else:
ii = 1
jj = i - 3
# Porous medium shading
axes[ii,jj].fill([0.3, 0.3, 0.59, 0.59],[0.0, 0.5, 0.5, 0.0], '0.5')
# Numerical data
if(i != 0):
x, y = getNumData(os.path.join(pathNum, times[i], fileNum))
axes[ii,jj].plot(x, y, 'b-')
# Experimental data
fileLab = 'b%i.dat' % (i + 1)
x, y = getLabData(os.path.join(pathLab, fileLab))
axes[ii,jj].scatter(x, y, facecolor='None', edgecolors='black')
if(i == 0):
axes[ii,jj].plot(x, y, 'b-')
# Cosmetics
axes[ii,jj].set_title('t = {0} s'.format(times[i]))
# axes[ii,jj].set_xlabel('x (m)')
# axes[ii,jj].set_ylabel('y (m)')
axes[ii,jj].set_xlim(0, 0.9)
axes[ii,jj].set_ylim(0.0, 0.4)
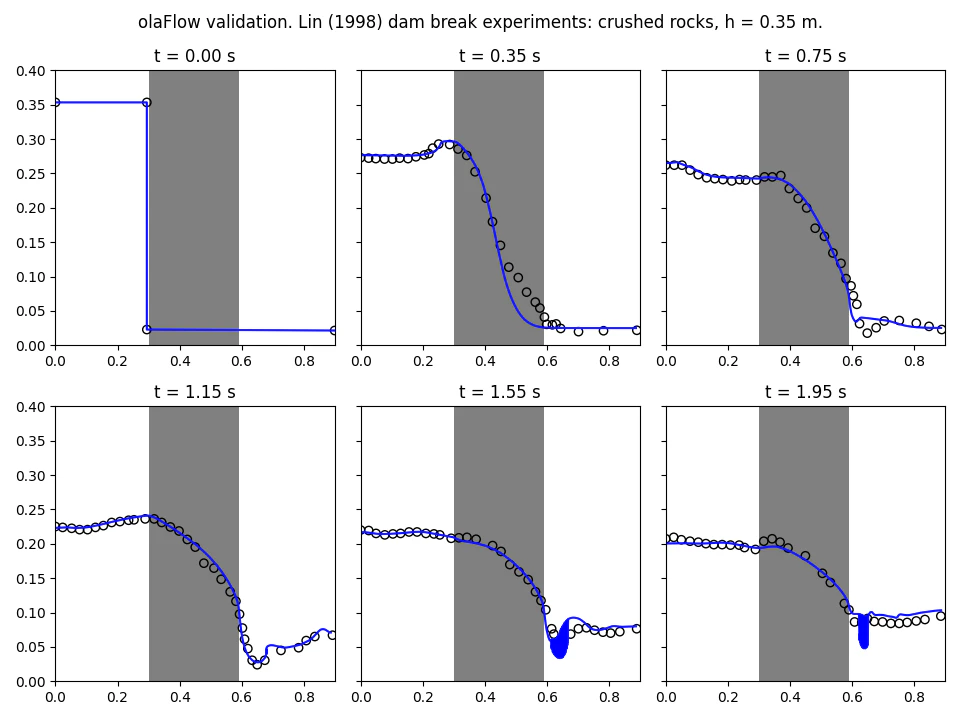
plt.suptitle('OLAFLOW validation. Lin (1998) dam break experiments: crushed rocks, h = 0.35 m.')
plt.savefig('plotValidation.png')
plt.show()
plotValidation.py の実行
$ python3 plotValidation.py
実行結果