はじめに
- Rでの日々バッチ分析結果を要約した統計量等をMattermostに入ってる関係者に通知したい
- 要約結果から詳細に知りたいと思った人向けに、詳細リンク(htmlレポートや Shiny Dashboard)を貼り、そこからアクセスしてもらう導線にもなる
方針
- mattermostに通知したい分析結果をRで記述する(script.R)
-
httr::POSTでmattermostに通知する
httrはHTTPリクエストを操作するRのパッケージです。適当にググってみてください。
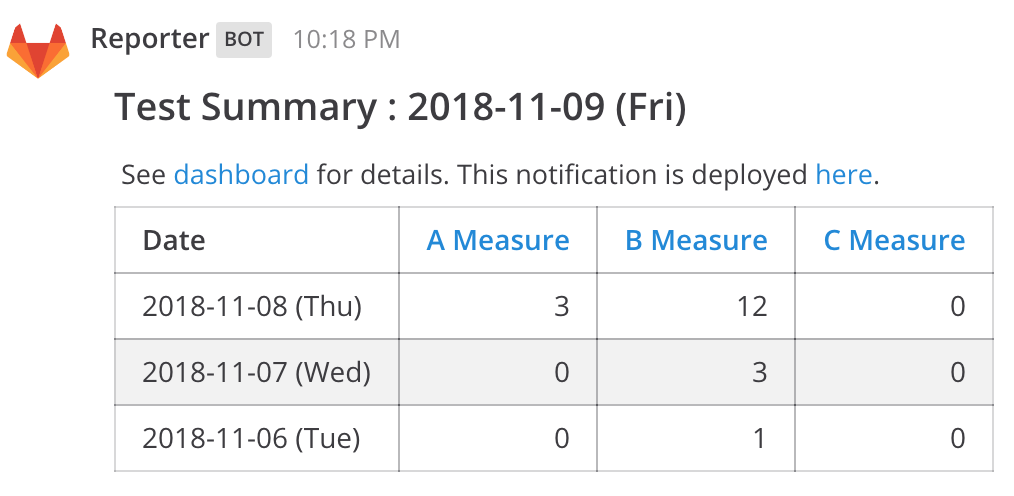
通知してるモノ
デザインはいろいろありますが、以下のフォーマットが基本的な感じです
How To
Incoming Webhook
Mattermostのincoming webhookにPayloadに必要なパラメータ名は書いてるので、それをみながら設定
table.summary <- kable(data, format = "markdown")
URL <- "http://[mattermost URL]/hooks/[TOKEN]"
day <- Sys.Date()
text <- paste0("#### Test Summary : ", day, " (",wday(day, label = T), ") \n See [dashboard](http://-) for details. This notification is deployed [here](http://-). \n\n", paste0(table.summary, collapse = "\n"))
httr::POST(url = URL, body = list(username = "Reporter", text = text))
MattermostのメッセージはMarkdown表記ができるので、表やリンクをMarkdown表記で書きます。無理やり感がありますが。
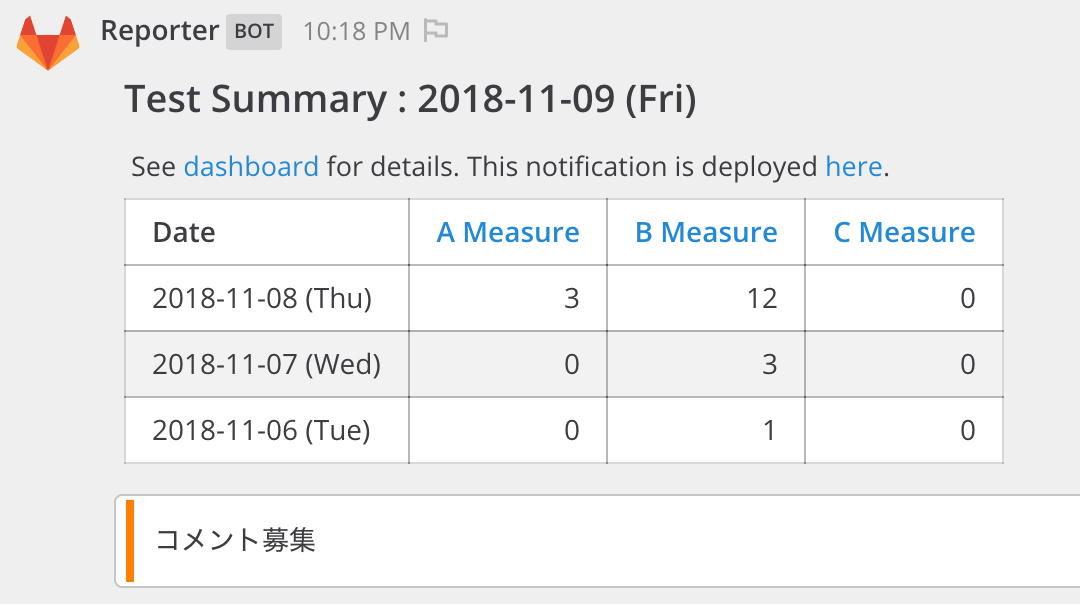
Attachments
mattermostでリッチな見た目のメッセージを送信するために、Attachmentsという機能がある
それでも同じようにかけるが、 bodyへの渡し方がちょっとややこしい
text2 <- list(attachments = list(list(pretext = text, text = "コメント募集", color = "#FF8000")), username = "Reporter")
httr::POST(url = URL, body = toJSON(text3, auto_unbox = T))
ポイントとしては、
- attachmentsパラメータはlistのlistで設定する。
-
jsonlite::toJSONのauto_unbox = Tが必要。これにより、要素が1つしかないvectorを展開してくれる
結果は以下のように、ColorLineを入れることもできました。他にもいろいろとリッチにできると思います
ggplotの図を添付するには?
slackrパッケージには、ggplotの結果をsaveしたpngファイルを添付することができるたみたいので、そのコードを参考にしましたが、mattermostの場合、attachmentsパラメータの中のimage_urlに図を示すURLを記述する必要があります。
しかし、httr::upload_file()をtoJSONの中で展開できないこともあるため、slackrのとおりにはいかないなと思いました。
これ適切なやり方あるのかな…