対象:自宅PC(Windows)
前回:プロセス/サービス監視、(任意で)イベントログも見えた
今回:気づける状態にする(=可視化から一段上へ)
この記事でやること(ゴール)
- Grafana Alerting で
- **Contact point(通知先)**を作る
- **Notification policy(ルーティング/まとめ/ノイズ低減)**を作る
- アラートルール(Prometheusのメトリクス中心)を作る
- (任意)Loki を入れている場合は、ログベースの検知も追加
0) なぜアラートはうるさくなるのか
個人PCでも “監視っぽいこと” をやると、だいたい以下で失敗します。
- しきい値が短絡的(CPU 90% を 1分で鳴らす、など)
- “瞬間的な揺れ”を拾いすぎる(=ノイズ)
- 通知が1件ずつバラバラに飛ぶ(=ウザい)
対策はシンプルで、以下を入れるだけで激変します。
- for(一定時間継続したら発報)
- まとめる(グルーピング)
- 夜は黙る/重要度で分ける(ポリシー)
1) Contact point(通知先)を作る
Grafana → Alerting → Contact points で作ります。

- まずは最小でOK:Email / Slack / Webhook のいずれか
- 自宅用途なら「Slack(自分だけのチャンネル)」が扱いやすいことが多いです
Contact point は「通知先の設定」です。
ルールから直接指定もできますが、Notification policy にぶら下げると運用が楽になります。

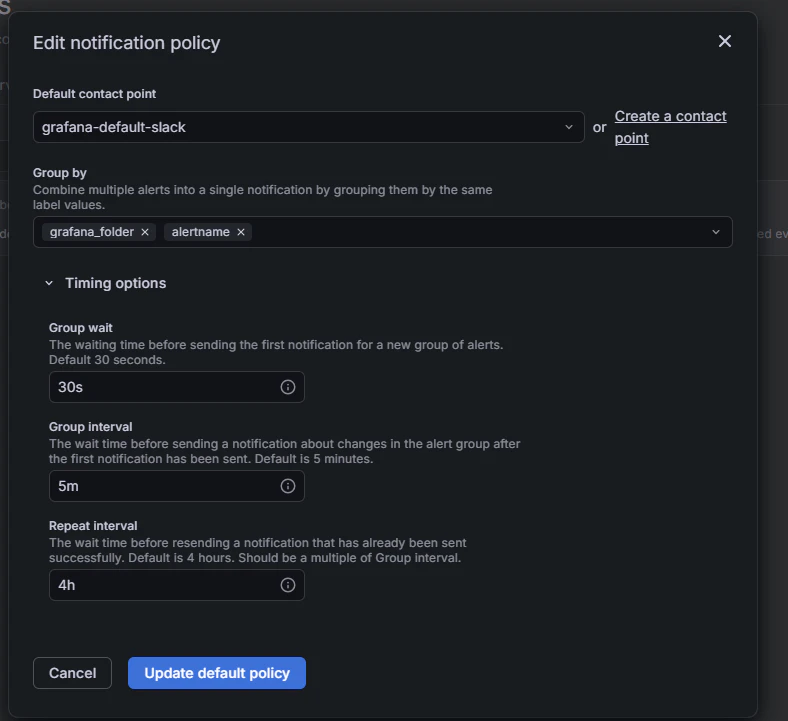
2) Notification policy(通知のルール/まとめ方)を作る
Grafana → Alerting → Notification policies。

ポリシーはツリー構造で、ラベルマッチでルーティングできます。
おすすめ(自宅PC用の最小):
- Root policy:Contact point を自分の通知先に
- Group by:
alertname(同種はまとめる) - Group wait:30s
- Group interval:5m
- Repeat interval:4h
“まとめ” が入るだけで通知疲れがかなり減ります。
3) アラートルール例(Prometheusメトリクス)
Grafana → Alerting → Alert rules → New alert rule

3.1 ディスク逼迫(C:)
条件例:C: の空きが 10% 未満が 15分続いたら。
クエリ(A):
100 * (windows_logical_disk_free_bytes{volume="C:"} / windows_logical_disk_size_bytes{volume="C:"})
判定(B):
- IS BELOW 10
for:
- 15m
理由:
- ディスク系は更新が遅い/揺れが出ることがあるので “長めのfor” が安全
3.2 Dockerサービスが落ちた
クエリ:
windows_service_state{name="com.docker.service", state="running"}
判定:
- IS BELOW 1
for:
- 3m
メッセージ(例):
- 「Dockerが落ちてる。再起動:services.msc → com.docker.service を再起動」
3.3 CPU高負荷が続く(短時間のピークは無視)
クエリ:
100 - (avg by (instance) (rate(windows_cpu_time_total{mode="idle"}[5m])) * 100)
判定:
- IS ABOVE 90
for:
- 10m
ポイント:
- 「ゲーム/ビルドで一瞬上がる」は無視したいので for で切る
4) (任意)ログベースのアラート(Lokiがある場合)
第2回で Loki を入れた場合、WindowsイベントログやAlloyログも見えます。
例:Systemログで “Error” が増えたら通知(5分で10件以上など)
クエリ(LogQLの例。ラベル名は環境に合わせて調整):
count_over_time({channel="System"} |= "Error" [5m])
判定:
- IS ABOVE 10
for:
- 0m〜5m(好み)
ログは “一時的に増える” が普通にあるので、通知は控えめ(しきい値高め / まとめ通知)がおすすめ。
5) うるさくしない運用チェックリスト
- まずは アラートは3つまで(ディスク/サービス/CPU)
- “迷ったら for を長め”
- 通知本文に「次に何をするか」を1行書く(迷いが減る)
- 夜は黙る(ポリシーで時間帯を分ける or 通知先を変える)
おわりに
ここまでで、
- 取る(Alloy)
- 溜める(Prometheus / Loki)
- 見る(Grafana)
- 気づく(Alerting)
が、自分のPCだけでひと通り揃いました。
この体験が、次に「サービス監視」「IoT」「チーム運用」へ広げる時の土台になります。
参考
Contact points(Grafana Alerting)
https://grafana.com/docs/grafana/latest/alerting/configure-notifications/manage-contact-points/
Notification policies(Grafana Alerting)
https://grafana.com/docs/grafana/latest/alerting/configure-notifications/create-notification-policy/
https://grafana.com/docs/grafana/latest/alerting/fundamentals/notifications/notification-policies/