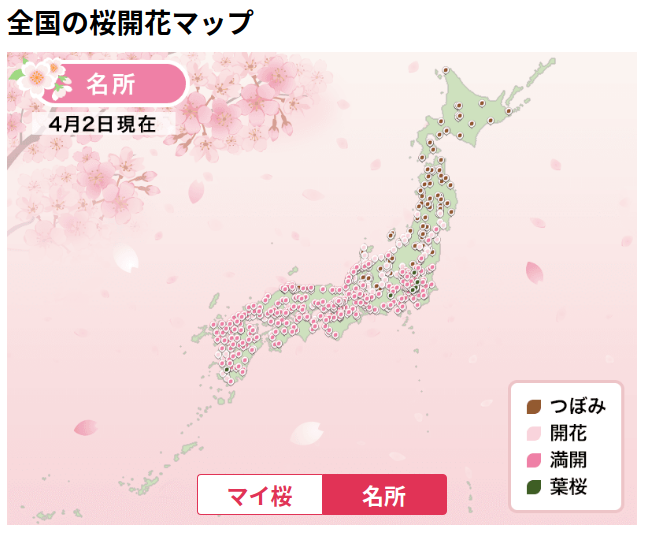
Rを使って簡易的にサクラの満開状況をマッピングします。
完成品はこんな感じ(4月2日時点)。

必要パッケージ
以下のパッケージを使用します。
library(tidyverse) # データ操作用
library(rtweet) # ツイート収集用
library(sf) # ベクタの操作用
library(emoGG) # 絵文字の描画用
インストールされていない場合はインストールしてください。
なおemoGGは公式リポジトリにはないので、remotes::install_githubを使ってGit Hubからインストールする必要があります dill / emoGG 。
remotes::install_github("dill/emoGG")
※公式なパッケージではないので入れるかどうかは自己判断で
ツイートの収集とデータの加工
ツイートの収集
ツイートの収集にはrtweet::search_tweetsを使います。
今回は過去一週間以内のツイートを最大18000件取得します。
クエリは「(桜 OR サクラ OR さくら) AND 満開」としました。「満開が終わった」も引っかかってしまいますがご愛嬌ということで。
Sys.time() %>% subtract( 3600 * 24 * 7 ) -> since_t # 起点の日時を取得
since_t %>% format( "%Y-%m-%d_%H:%M:%S_JST" ) -> since # フォーマットを変換

rt <- search_tweets(q = "(桜 OR サクラ OR さくら) AND 満開", n = 18000, since = since, include_rts = FALSE) # リツイートを含めず、ツイートを取得
search_tweetsは開発者登録なしで使用できますが、初回使用時にはブラウザでユーザ認証が求められます。
参考:
データの加工
収集したツイートのデータはtibbleに格納されます。そこから位置情報が付属しているツイートのみを抽出します。
今回は「bbox_coords」から座標を得るので、対応している「country_code」を判定基準にしました。
rt %>% filter(country_code == "JP") -> rt.with.coords # country_codeが"JP"の行を選択
「bbox_coords」にはグリッドの頂点の座標がリストとして格納されています。
一つのツイートに対して地図上の一点をを対応させたいので、グリッドの中心座標を算出します。
rt.with.coords %>% select(bbox_coords) %>% # bbox_coordsを抜き出し
    map(unlist) %>% unlist %>% matrix(ncol = 8, byrow = TRUE) %>% # リストを解除して行列にまとめなおす
    set_colnames(c("lon1", "lon2", "lon3", "lon4","lat1", "lat2", "lat3", "lat4")) %>%  # 列名を変更する
    as_tibble %>% mutate(lon = (lon1 + lon2) / 2, lat = (lat1 + lat3) / 2) -> coords # グリッドの中心を算出し、新しい列に格納する
tidyverseをうまく使えばもっときれいに書けるかも?
これでデータの準備は完了です。
地図の準備
今回は都道府県別日本地図(GeoJSON、TopoJSON形式)をベースマップとして使用します。国土地理院が公開している地球地図日本を扱いやすいように加工したものだそうです。
リンク先からZIPをダウンロードして解凍し、その中の「japan.geojson」を作業ディレクトリに移動します。
その後sf::st_readで読み込みます。
map <- st_read("japan.geojson")
ggplot2で描画
以上のデータをggplot2で描画します。
サクラの絵文字コードは以下のコマンドで検索して確認しました。
> emoji_search("flower")
              emoji             code keyword
1928  wilted_flower            1f940  flower
1940 cherry_blossom            1f338  flower # <- これを使う
2748        rosette            1f3f5  flower
4130              o             2b55  circle
4131              o             2b55   round
5234        eritrea 1f1ea\\U0001f1f7      er
以下が描画コードです。
g <- ggplot() + geom_sf(data = map) + # 地図の描画
    geom_emoji(data = coords, aes(x = lon, y = lat), emoji="1f338", size = 0.02) + # 絵文字の描画
    xlab("経度") + ylab("緯度") + # ラベルの変更
    annotate(geom = "text", label = "背景地図:国土地理院・地球地図日本(http://www.gsi.go.jp/kankyochiri/gm_jpn.html)", x = 147, y= 20, size = 2) # 出典を追加

ggsave(g, filename = "sakura.png") # sakura.pngに保存
これで完了です。
完成図
一番最初にも上げたものが完成図になります。
かなり簡易的なやり方でしたが日本気象協会やウェザーニューズのものと比較してもいい感じです。
| 完成図 | 日本気象協会 | ウェザーニューズ |
|---|---|---|
 |
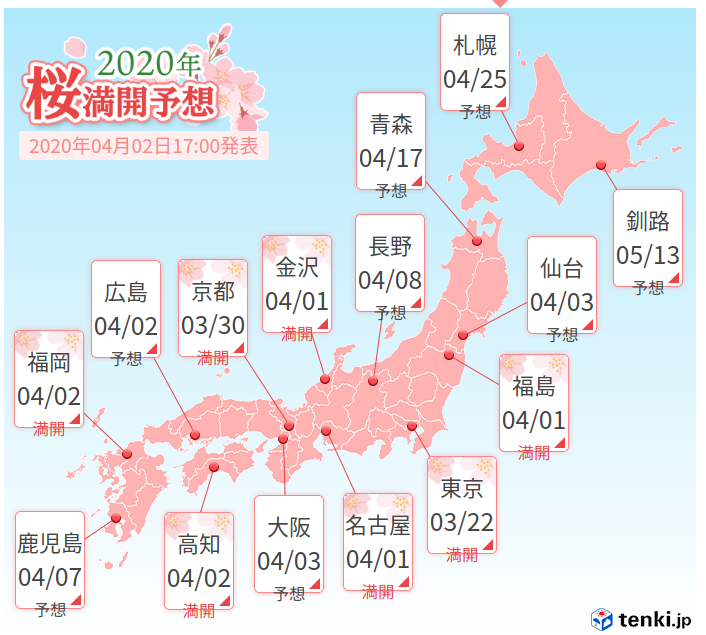 |
 |
| https://tenki.jp/sakura/ | https://weathernews.jp/s/sakura/ |
検索する対象や検索の方法、描画する絵文字を変えればいろいろな地図が作れると思います。ぜひ試してみてください。
来年こそは楽しくお花見しましょう!