作成日:20210313
言語:Python
matplotlibで描画した図を書き出しする時に、余白なしで保存したい。
画像の上にラベルを上書きしてplotしてある場合に、matplotlibのplt.savefig関数を使ってファイルを保存することを想定している。
補足:本記事でカバーできていないこと -- 他のパッケージを用いた画像保存
1. 参考リンク
matplotlib ver3.3.4 公式ページより Customizing Matplotlib with style sheets and rcParams
https://matplotlib.org/stable/tutorials/introductory/customizing.html?highlight=figure.subplot.[name]#a-sample-matplotlibrc-file
matplotlibのめっちゃまとめ
https://qiita.com/nkay/items/d1eb91e33b9d6469ef51
※ 上記の記事には直接「余白をなくす」コマンドは載っていないが、matplotlibでの描画について理解する際の参考にした。
2. サンプルコード
2-1. デフォルト表示(余白あり)
### 余白あり
import matplotlib.pyplot as plt
from skimage import io

img = io.imread('sample_sashimi.jpg')
fig, ax = plt.subplots(figsize=(img.shape[1]/10, img.shape[0]/10))

## デフォルトでは余白(figure背景)とウェブページ背景との区別がつかないので、背景の色を変更
fig.patch.set_facecolor('antiquewhite')

## 画像を表示
plt.imshow(img, cmap='gray')

## 画像上に円をプロット
c = plt.Circle((500, 500), 20, color='cyan', linewidth=1, fill=True)
ax.add_patch(c)

plt.axis('tight')
plt.axis('off')

plt.savefig('sushi_margin.jpg') #写真の周りに余白がある
plt.show()
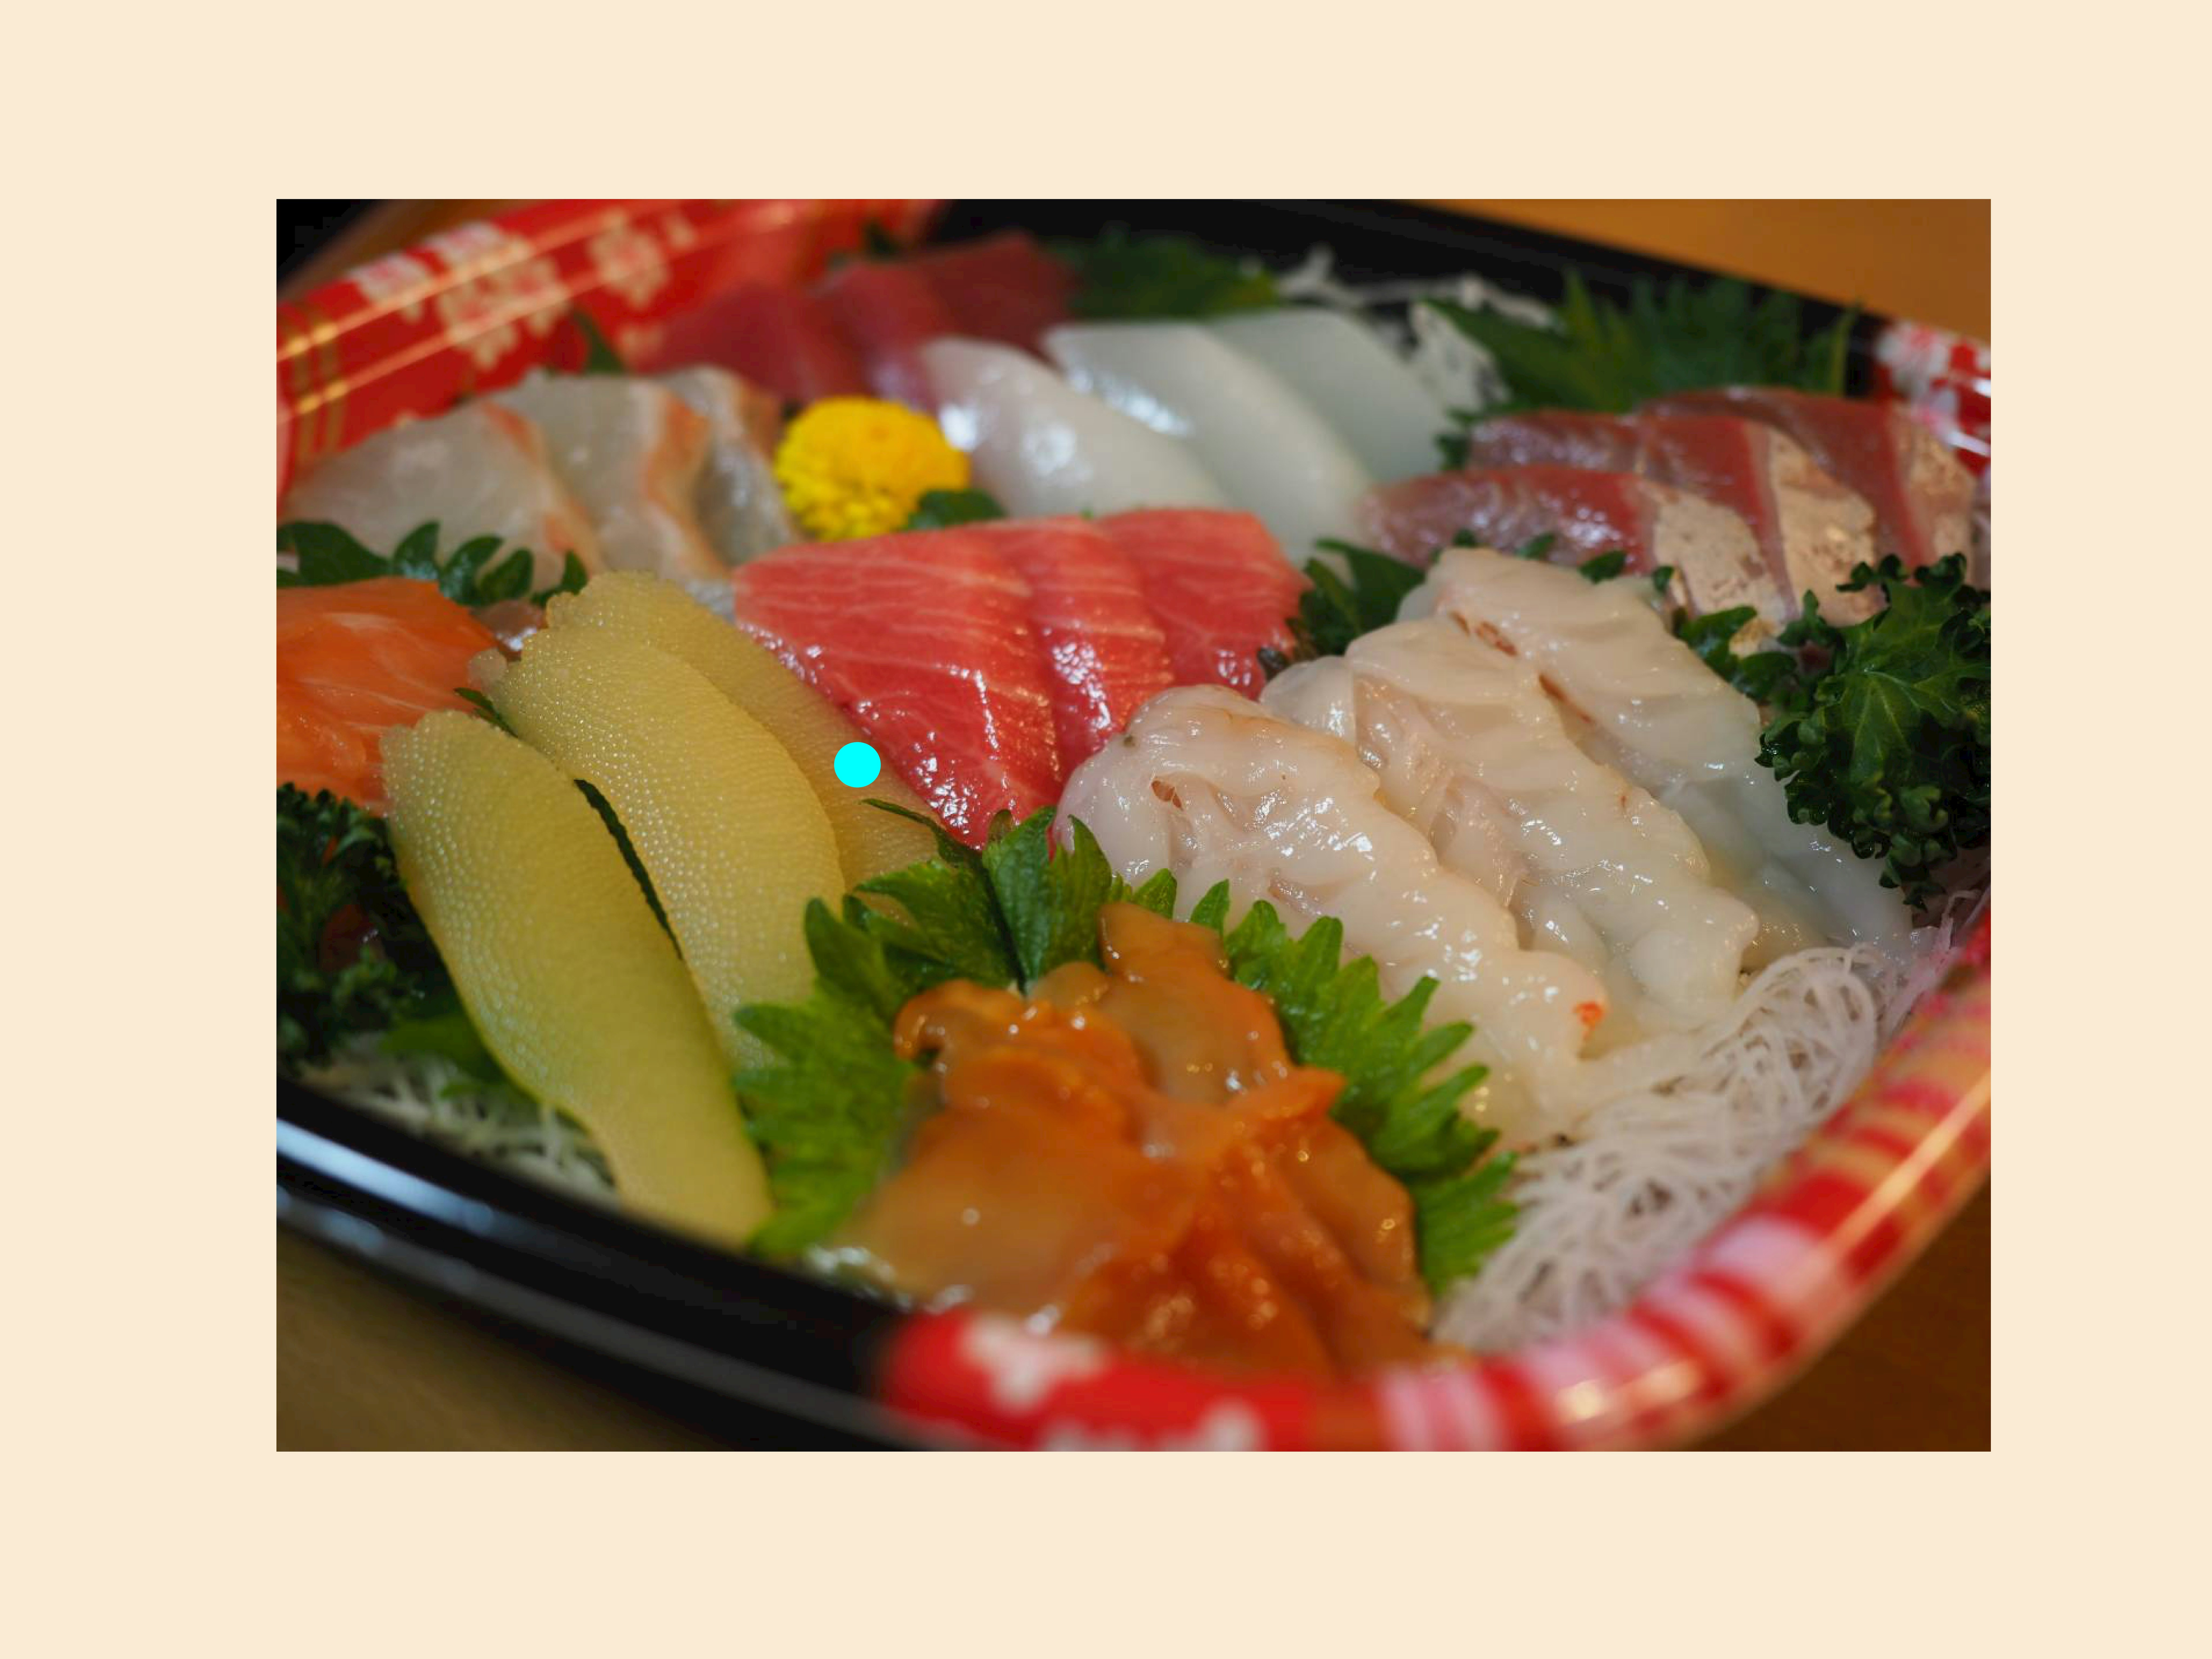
ベージュがかった色がついている部分が余白として出力されている。この余白を消したい。
2-2. 余白なし -- fig.subplots_adjust()
fig.subplots_adjust()で余白を変更する。
plt.savefig()の前に、fig.subplots_adjust(left=0, right=1, bottom=0, top=1) という1行を入れればよい。
ただし、figsizeの指定に注意(詳しくは下記のサンプルプログラム中のコメントを参照)。
### 余白なし
import matplotlib as mpl
import matplotlib.pyplot as plt
from skimage import io #比較用


fig, ax = plt.subplots(figsize=(img.shape[1]/10, img.shape[0]/10))
# 【注意】
# figsizeは画像の縦横比と一致させること。
# ここでfigsize=(10,10)などと元の画像の縦横比と違う値を指定してしまうと、
# 無理やり余白をゼロにしようとしてfigsizeに合わせて画像の縦横比が変更されてしまうので注意。

## デフォルトでは余白(figure背景)とウェブページ背景との区別がつかないので、背景の色を変更
fig.patch.set_facecolor('antiquewhite')

## 画像を表示
plt.imshow(img, cmap='gray')

## 画像上に円をプロット
c = plt.Circle((500, 500), 20, color='cyan', linewidth=1, fill=True)
ax.add_patch(c)

plt.axis('tight')
plt.axis('off')
fig.subplots_adjust(left=0, right=1, bottom=0, top=1) #この1行を入れる
plt.savefig('sushi_no_margin.jpg')

## 参考:比較用にio.imsaveで保存してみる
io.imsave('sushi_io.jpg', img) #io.imsaveでは新たに描画した図形は出力されない

plt.show()
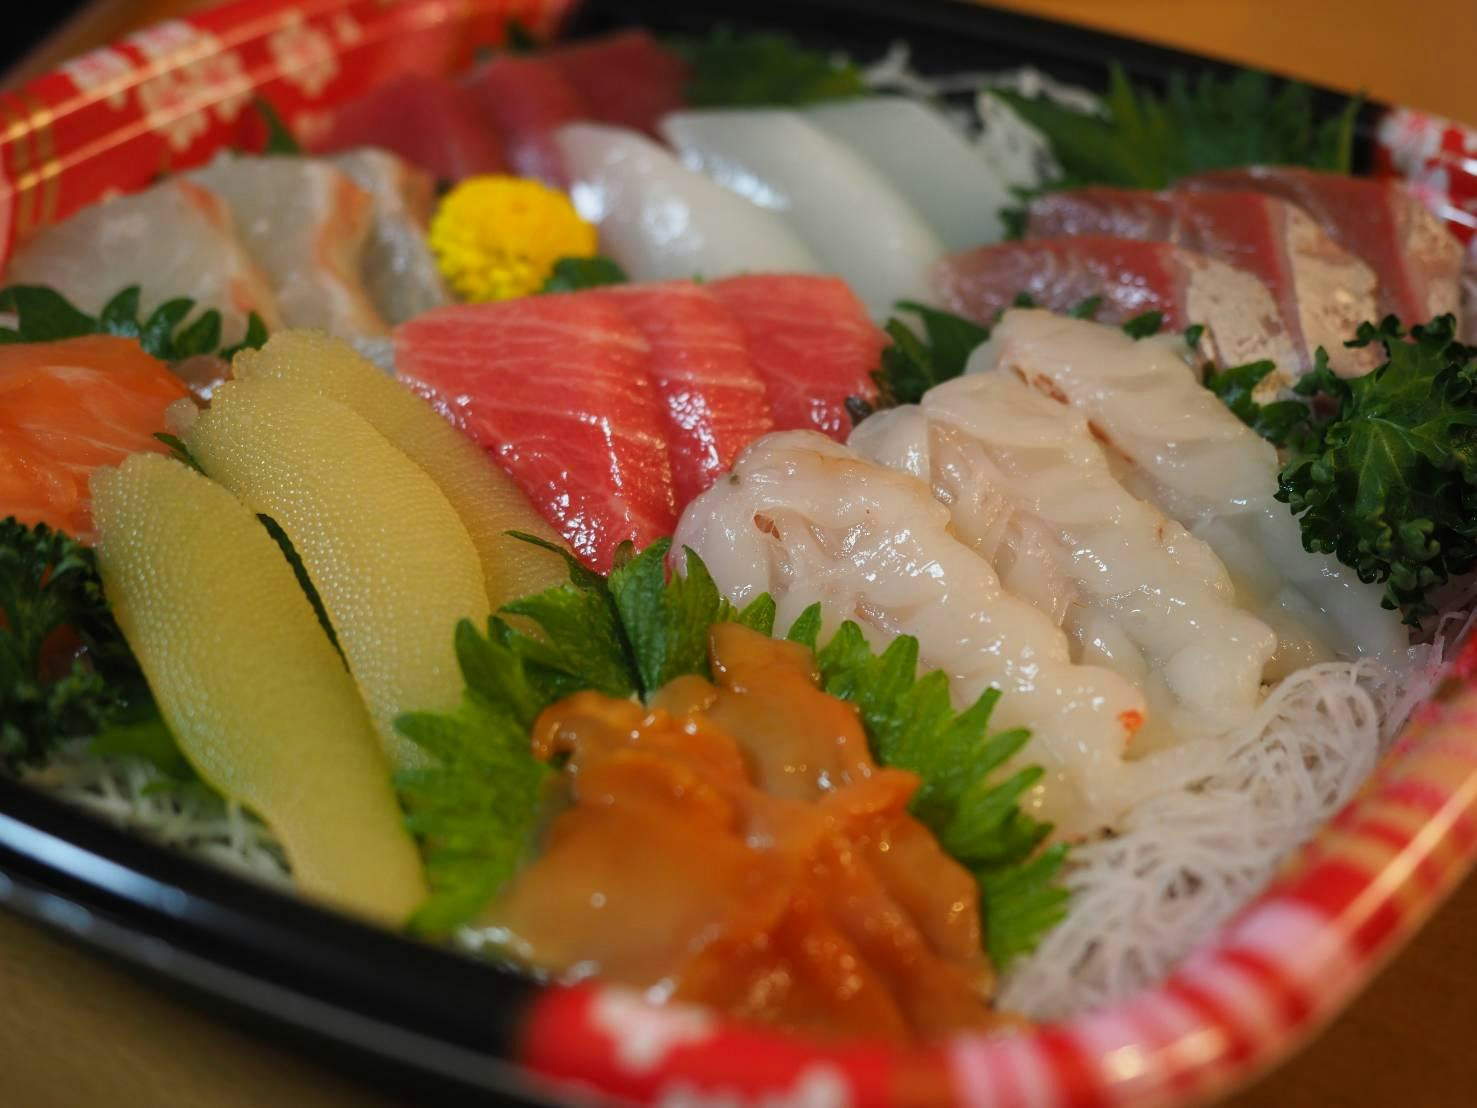
余白がなくなった。
ちなみに、io.imsaveで保存した結果が下の図。上書きしたプロット(ここではシアン色の円)が保存されない。

3. 補足 -- matplotlib.rcParams でfigureのレイアウト設定を変更する
SubplotParams(fig.subplots_adjust())は、キャンバス左下を(0,0)・右上を(1,1)として、Axesの位置を決めるパラメタ。
余白に限らず、レイアウトの設定を変更したい時には、matplotlib rc file中のrcParamsを一時的に変更すれば良い。
matplotlib rc fileというのは、matplotlibが最初にconfigureされた時に読み込まれる設定ファイルで、デフォルトの図のレイアウト設定を規定している。そこのパラメタを一時的に変更すれば、figureのレイアウトを好きに調節できる(※)。
※補足
詳しくは下記リンク参照。
matplotlib ver3.3.4 公式ページより Customizing Matplotlib with style sheets and rcParams
rc fileの中身を見てみると、marginのパラメタを指定する部分は以下のようになっている。
## The figure subplot parameters.  All dimensions are a fraction of the figure width and height.
# figure.subplot.left:   0.125  # the left side of the subplots of the figure
# figure.subplot.right:  0.9    # the right side of the subplots of the figure
# figure.subplot.bottom: 0.11   # the bottom of the subplots of the figure
# figure.subplot.top:    0.88   # the top of the subplots of the figure
jupyter notebook上でこれらのパラメタを表示してみる。
import matplotlib as mpl

print(mpl.rcParams['figure.subplot.left']) #0.125
print(mpl.rcParams['figure.subplot.right']) #0.9
print(mpl.rcParams['figure.subplot.bottom']) #0.125
print(mpl.rcParams['figure.subplot.top']) #0.88
print(mpl.rcParams['figure.subplot.left'])などでパラメタを表示すると、left、right、bottom、topはそれぞれ0.125、0.9、0.125、0.88となっている。fig.subplots_adjust()ではデフォルト値は変更されず、現在描画しているのfigureでだけ変更される。
# 余白の変更は、
fig.subplots_adjust(left=0, right=1, bottom=0, top=1)
# と書いても、

import matplotlib as mpl
mpl.rc('figure.subplot', left=0, right=1, bottom=0, top=1)
# と書いても、どちらでも同じ結果になる。


# ただし、
mpl.rcParams['figure.subplot.left']=0
mpl.rcParams['figure.subplot.right']=1
mpl.rcParams['figure.subplot.bottom']=0
mpl.rcParams['figure.subplot.top']=1
# とするとデフォルトの設定ごと書き換わってしまうので、これはやらない方が良さそう。
__終わり__

