はじめに
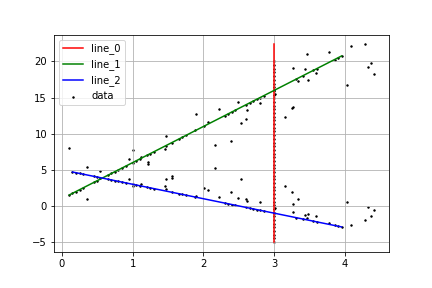
RANSACを用いて、下図のような点群データから複数の二次元直線を検出してみました。
【お勉強してみた】RANSACのおはなしの記事を参考にしながら、一から実装してみます。
RANSAC(Random sample consensus)
ロバスト推定であるRANSACですが、対象データの情報(誤差範囲や検出対象のデータ点数)が分かる場合に、とても有効な手法です。最小二乗法による線形回帰では、全てのデータを使用してモデルのパラメータを推定しますが、RANSACでは、ランダムに抽出された一部のデータからパラメータを推定することで、外れ値の影響を少なくしています。
前提
今回、点群データから直線$ax+by+c=0$を検出したいので、推定するパラメータは3つとなります。また直線を検出したいのでサンプリングデータは2点として、直接パラメータ$a,,b,,c$を求めることにします。なので、推定された直線は必ずデータ内の2点を通ることになります。
補足
scikit-learn(sklearn.linear_model.RANSACRegressor)にも関数がありますが、回帰での使用が前提であり点群データには不適切です。
実装
1. import
import numpy as np
import matplotlib.pyplot as plt
2. サンプルデータの作成
点群を適当に作成します。
m_1 = 5
n_1 = 1

m_2 = -2
n_2 = 5

x = np.arange(0, 4, 1/20)
y_1 = m_1*x + n_1
y_2 = m_2*x + n_2

paral = np.ones((50, 2))
paral[:, 0] = 3
paral[:, 1] = np.linspace(-5, 20, 50)

# ノイズを追加
for idx_1,  idx_2  in np.random.choice(len(x), (20,2), replace=False):
    y_1[idx_1] += 4*np.random.normal(0, 0.5)
    x[idx_1] += np.random.normal(0, 0.5)

    y_2[idx_2] += 4*np.random.normal(0, 0.5)
    x[idx_2] += np.random.normal(0, 0.5)

points_1 = np.vstack([x, y_1]).T
points_2 = np.vstack([x, y_2]).T
point_cloud = np.concatenate([points_1, points_2, paral])

# 表示
plt.scatter(point_cloud[:,0], point_cloud[:,1], s=2, label="data")
plt.legend()
plt.grid()
plt.show()
3. 関数の定義
3つの関数を作成してます。
- euclid:直線とデータ点の距離を計算する
- get_params:2点から直線$ax+by+c=0$のパラメータ$a,,b,, c$を求める
- model:$b\neq 0$のとき、直線$y=mx+n$の形に変形(描画用)
def euclid(params, p):
    a = params[0]
    b = params[1]
    c = params[2]
    x = p[0]
    y = p[1]
    norm = np.linalg.norm([a, b])
    dist = np.abs(a*x + b*y + c) / norm
    return dist

def get_params(samples):
    p = samples[0]
    q = samples[1]
    a = p[1] - q[1]
    b = q[0] - p[0]
    c =  p[0] * q[1] - q[0] * p[1]
    return a, b, c

def model(params, x):
    a = params[0]
    b = params[1]
    return a * x + b
4. RANSAC
RANSACを実行する前に決定するパラメータが3つあります。
- max_loop:学習回数
- threshold:全データ点に対して直線のインライアとするか、しないかを定める閾値
- min_samples:インライアの最小個数
上記のパラメータを決定したら、RANSACを実行できます。
基本的な流れは以下:
- 全データ点の中から2点を抽出(直線検出なので2点で十分であり、モデルに応じて決定する)
- サンプルされた2点から直線$ax+by+c=0$を推定
- 全データに対して、直線との距離がthreshold以下のものをインライア(正常値)とする
- 全てのインライアの点に対して直線との距離を計算
- これをmax_loop分繰り返して、距離が最小なパラメータを結果とする
class RANSAC_Euclid():
    def __init__(self,
                n=2,
                max_loop = 100,
                threshold = 0.15,
                min_samples = 20,
                loss="euclidean_dist"
                 ):
                self.n = n
                self.max_loop = max_loop
                self.min_samples = min_samples
                self.threshold = threshold
                self.loss = loss

    def run_ransac(self, data, view=True):
        max_loop = self.max_loop
        min_samples = self.min_samples
        threshold = self.threshold
        loss = self.loss

        models_params = []
        model_errors = []
        iterations = 0
        inlers_list = []

        while iterations < max_loop:
            sample = data[np.random.choice(len(data), size=2, replace=False)] # 適当な2点をパラメータ推定(直接)に使用
            params = get_params(sample)
            inliers = []

            #全データに対して
            for p in data:
                if (p==sample).all(1).any():
                    continue
                if euclid(params, p) > threshold:
                    continue
                else:
                    inliers.append(p)

            if len(inliers) > min_samples:
                error = np.array([euclid(params, p) for p in inliers]).mean() # 全ての正常値と直線との距離を計算
                model_errors.append(error)
                models_params.append(params)
                inlers_list.append(len(inliers))
            iterations += 1

        if len(model_errors) != 0:
            best_index = np.argmin(model_errors)
            best_params = models_params[best_index]
            residuals_subset = np.array([euclid(best_params, p) for p in data])
            inlier_mask_subset = (residuals_subset <= threshold)
            inlier = data[inlier_mask_subset]

            self.inlier_mask_ = inlier_mask_subset

            # 正規化
            a = best_params[0]/np.linalg.norm([best_params[0], best_params[1]])
            b = best_params[1]/np.linalg.norm([best_params[0], best_params[1]])
            c = best_params[2]/np.linalg.norm([best_params[0], best_params[1]])
            return a, b, c
        else:
            raise ValueError(
                        f"up threshold({self.threshold})"
                    )
5. 結果の表示
今回サンプルデータから直線が3本検出したいので、detect_lineは3としてます。複数検出ということですが、まあRANSACを繰り返しているだけです。paramsに検出したパラメータを格納しているので、中身を見るとサンプルデータで設定したパラメータに近い値が出ていると思います。
point_cloud_original = point_cloud

detect_line = 3
max_loop = 100
threshold = 0.005
min_samples = 25

color_list = ["r", "g", "b"]
params = []
for line in range(detect_line):
    ran = RANSAC_Euclid(max_loop=max_loop, threshold=threshold, min_samples=min_samples)
    a,b,c = ran.run_ransac(point_cloud)
    params.append([a,b,c])

    inlier = ran.inlier_mask_
    outlier = ~inlier

    if b != 0:
        m = -a/b
        n = -c/b
        x_min = np.min(point_cloud[inlier][:,0])
        x_max = np.max(point_cloud[inlier][:,0])
        y_pred1 = model([m,n], x_min)
        y_pred2 = model([m,n], x_max)
        plt.plot([x_min, x_max], [y_pred1, y_pred2], color=f"{color_list[line]}", label=f"line_{line}")
    else:
        x = np.ones(2) #初期化
        x[:] = -c/a
        y_max = np.max(point_cloud[:,1])
        y_min = np.min(point_cloud[:,1])
        plt.plot(x, [y_min, y_max], color=f"{color_list[line]}", label=f"line_{line}")

    point_cloud = point_cloud[outlier]

plt.scatter(point_cloud_original[:,0], point_cloud_original[:,1], s=2, c="black", label="data")
plt.legend()
plt.grid()
plt.show()
まとめ
点群データから3本の直線を検出できました。今回は、必ず2点を通る直線を求めてきたのですが、インライアのデータ点を使って直線のパラメータを再度学習(微調整)しても良いと思います。"multi RANSAC"とかで検索すると、色々論文が出てくるので時間あるときにでも実装しようと思ってます。
参考文献
- 【お勉強してみた】RANSACのおはなし
- scikit-learn RANSACRegressor

