前提
急にGUIを作れと言われた。ボタンとかでいろいろ制御できるリアルタイムグラフ描画をしたいが、性能は問われない。
gnuplot触ったことないし、C#もよくわからんが、Pythonは触ったことあるのでmatplotlibを使ってみる。
難しいこととか変な(?)ライブラリへの依存はしたくないのでPython3系のtkinterを使う。
表示したいのは以下。
- 折れ線グラフ複数
- カラーマップと対応するカラーバー
- 制御用のボタンとか
事前にpip install numpy matplotlibしておく必要がある。
(Ubuntuの場合はその前にsudo apt install python3-pip python3-tkしておく)
詳細
最初の一歩
ボタンとグラフを同時に表示する必要があるので、matplotlib.orgの検索窓にでtkinterと入れてみる。
するとEmbedding in Tkが一番上にある。
それから、リアルタイム描画ということでアニメーションする必要があるので、同様にanimationと入れてみる。
すると、今度は少し下のほうにAnimated line plotが見つかる。
今回はボタンなどを配置しつつアニメーションしたいので上記二つを組み合わせる必要がある。
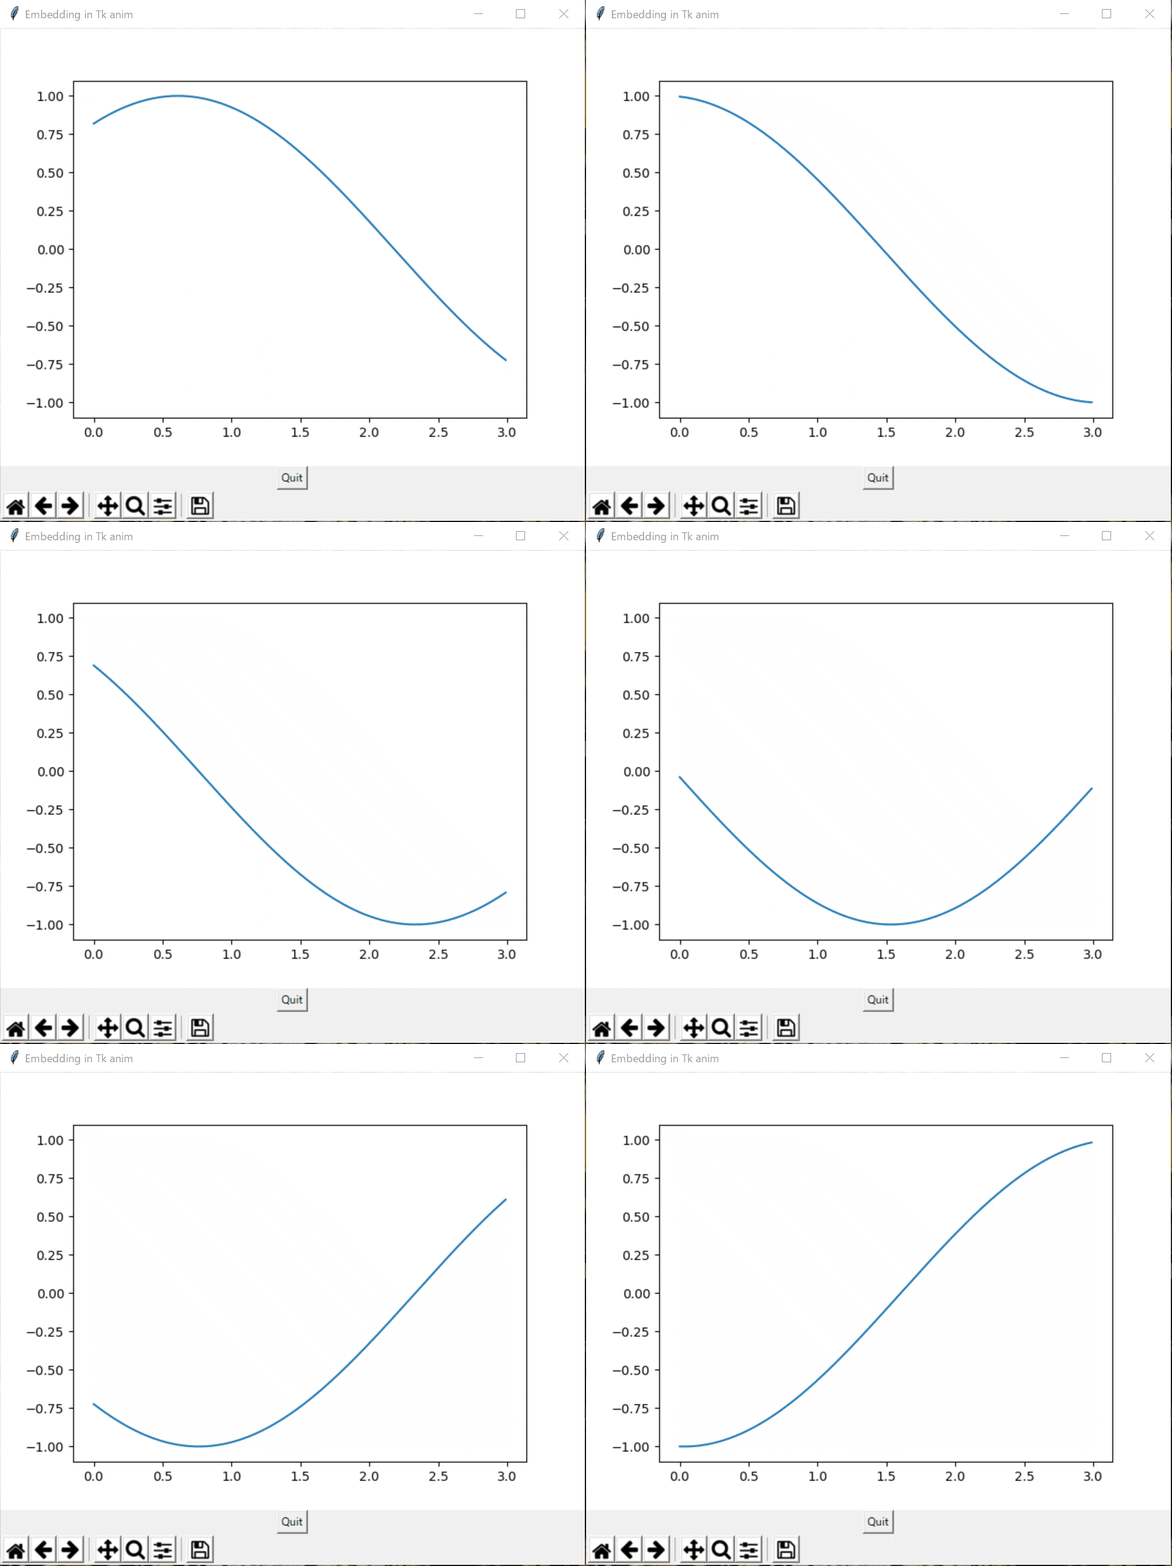
Animated plot in Tk
Embedding in TkとAnimated line plotを合体して、少し整理した。
# !/usr/bin/env python3


# https://matplotlib.org/gallery/user_interfaces/embedding_in_tk_sgskip.html
# https://matplotlib.org/gallery/animation/simple_anim.html


import tkinter

from matplotlib.backends.backend_tkagg import (
	FigureCanvasTkAgg, NavigationToolbar2Tk)
from matplotlib.figure import Figure
import matplotlib.animation as animation

import numpy as np


def _quit():
	root.quit()     # stops mainloop
	root.destroy()  # this is necessary on Windows to prevent
					# Fatal Python Error: PyEval_RestoreThread: NULL tstate


def init():  # only required for blitting to give a clean slate.
	line.set_ydata(np.sin(x))
	return line,


def animate(i):
	line.set_ydata(np.sin(x + i))  # update the data.
	return line,


root = tkinter.Tk()
root.wm_title("Embedding in Tk anim")

fig = Figure()
# FuncAnimationより前に呼ぶ必要がある
canvas = FigureCanvasTkAgg(fig, master=root)  # A tk.DrawingArea.

x = np.arange(0, 3, 0.01)  # x軸(固定の値)
l = np.arange(0, 8, 0.01)  # 表示期間(FuncAnimationで指定する関数の引数になる)
plt = fig.add_subplot(111)
plt.set_ylim([-1.1, 1.1])
line, = plt.plot(x, np.sin(x))

ani = animation.FuncAnimation(fig, animate, l,
	init_func=init, interval=10, blit=True,
	)

toolbar = NavigationToolbar2Tk(canvas, root)
canvas.get_tk_widget().pack()

button = tkinter.Button(master=root, text="Quit", command=_quit)
button.pack()

tkinter.mainloop()
ボタンとかは、普通にtkinterで配置できる。
見た目
注意点
-
animation.FuncAnimation()で返ってくるオブジェクト(上記コードではani)の参照がない(?)とグラフが更新されないことがある。
クラスにした場合は、self.aniとかに格納して大事に持っておく必要がある。
(上記コードでは、ani = ...がないとだめかもしれない。) -
set_ydata()とかset_data()では、データ以外の表示は更新されない。
Y軸範囲を自動追従したい場合とかは、自前でset_ylim()する必要がある。 -
blit=Trueだとグラフが更新されない(軸ラベルだけの更新とかが反映されない)ことがある。
ボタンでX軸表示モード変えたいのに変わらない時はblit=Falseにしてみるといいかもしれない。
応用(?)例
PythonでI2Cセンサ(CCS811/BME280)を読んで色々表示してみたで、今回の成果を使った。
matplotlibでの表示は、このコード(example.py)。センサで値を取得する関係でクラスを使ってごにょごにょした。
