はじめに
書籍「pandasライブラリ活用入門」の「3.4.3.2 サイズと形」で出てくる seaborn によるプロットでエラーになる箇所があったのでメモします。
なお、ここでは1番目の図について説明します。2番目も違う理由で動作しなかったので、こちらに記事を作りました。
動作環境
- Python 3.7
- seaborn 0.11.1
- matplotlib 3.2.2 (Colab) / matplotlib 3.4.2 (local PC)
現象
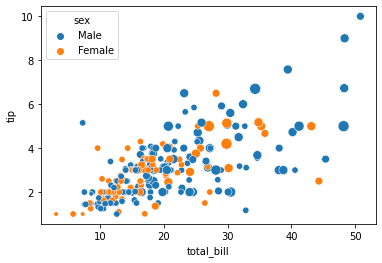
データのsize列の値によって散布図のマーカーサイズを出し分ける図です。下のようなコードが示されています。
import seaborn as sns
from matplotlib import pyplot as plt

tips = sns.load_dataset('tips')
sns.lmplot(
    data=tips,
    x='total_bill',
    y='tip',
    fit_reg=False,
    hue='sex',
    scatter_kws={'s': tips['size'] * 10}
)
plt.show()
しかし、これを実行すると ValueError となってしまいます。
ValueError: s must be a scalar, or float array-like with the same size as x and y
StackOverflow で質問したところ、このような使い方はそもそも想定されていなかった(たまたま動いていたのがバージョンアップで検証処理が入り動作しなくなった)とのこと。
解決策
このような場合は lmplot ではなく scatterplot を使った方が素直に書けます。(回答者さんありがとうございます。)
sns.scatterplot(
    data=tips,
    x='total_bill',
    y='tip',
    hue='sex',
    s=tips['size'].mul(20),
    # size='size',  # s または size のいずれかを指定
)