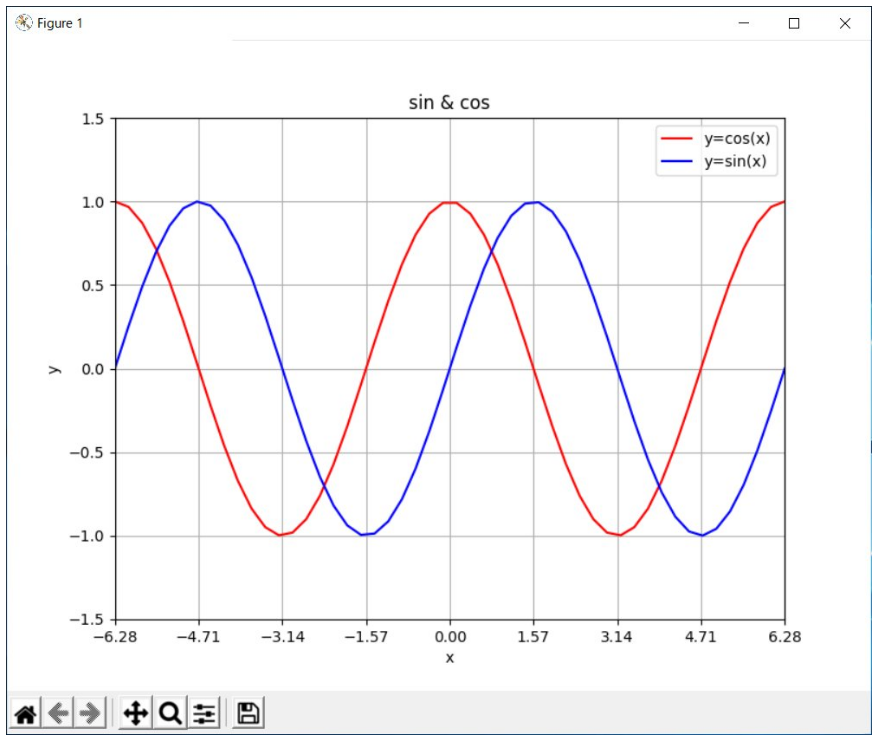
sinとcosのグラフを描く(凡例表示)
import matplotlib.pyplot as plt
import numpy as np

x = np.linspace(-2*np.pi, 2*np.pi)
y1 = np.sin(x)
y2 = np.cos(x)

plt.plot(x, y1, color='b', ls='-', label='y=sin(x)')
plt.plot(x, y2, color='r', ls='-', label='y=cos(x)')

plt.xlim(-2*np.pi, 2*np.pi)
plt.ylim(-1.5, 1.5)

plt.xticks([-2*np.pi, -(3/2)*np.pi, -np.pi, -(1/2)*np.pi,
           0, (1/2)*np.pi, np.pi, (3/2)*np.pi, 2*np.pi])

plt.legend()
plt.grid()
plt.xlabel('x')
plt.ylabel('y')
plt.title('sin & cos')

plt.show()
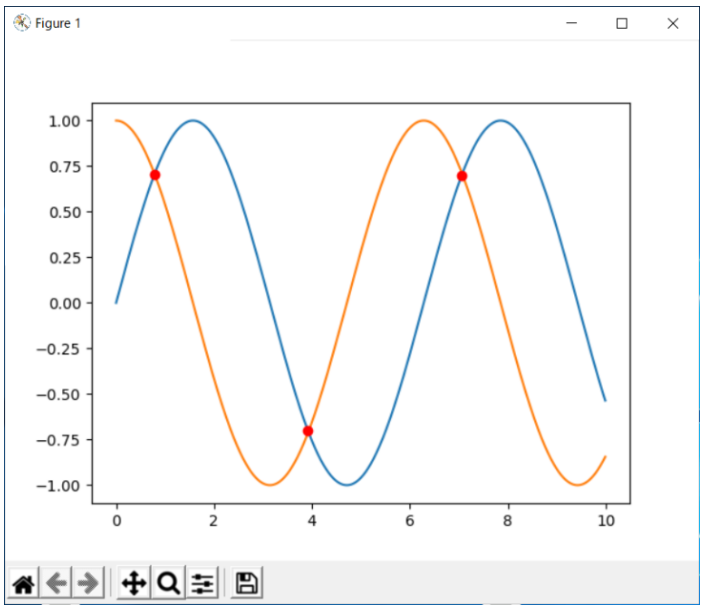
sinとcosのグラフ交点をプロットする
import numpy as np
import matplotlib.pyplot as plt

# np.arange 等差数列
# numpy.arange([start, ]stop, [step, ]dtype = None)
x = np.arange(0, 10, 0.01)
y1 = np.sin(x)
y2 = np.cos(x)

plt.plot(x, y1, '-')
plt.plot(x, y2, '-')

# argwhere 配列をnumpy.argwhere()に渡すと、値が0以外の要素のインダイスをインダイスごとに返す。
# numpy.sign() 符号を取得する。
idx = np.argwhere(np.diff(np.sign(y1 - y2))).flatten()
plt.plot(x[idx], y1[idx], 'ro')
plt.show()