はじめに
Elasticは様々なソフトウェアやクラウドサービスのメトリックやログを集めることができますが、Prometheusで集めているメトリックをPromQLでクエリーしてElasticに入れることもできます。
今回はその一例を試してみました。
今回利用したElastic はバージョン9.3.3です。
アーキテクチャ
生成AIに書かせた今回のアーキテクチャ図です。楽をしたかったのでAWS Managed Service for Prometheus (AMP) を使いました。Elastic AgentのPrometheus Integrationを使ってPrometheusからデータをプルしてElasticsearchに入れます。
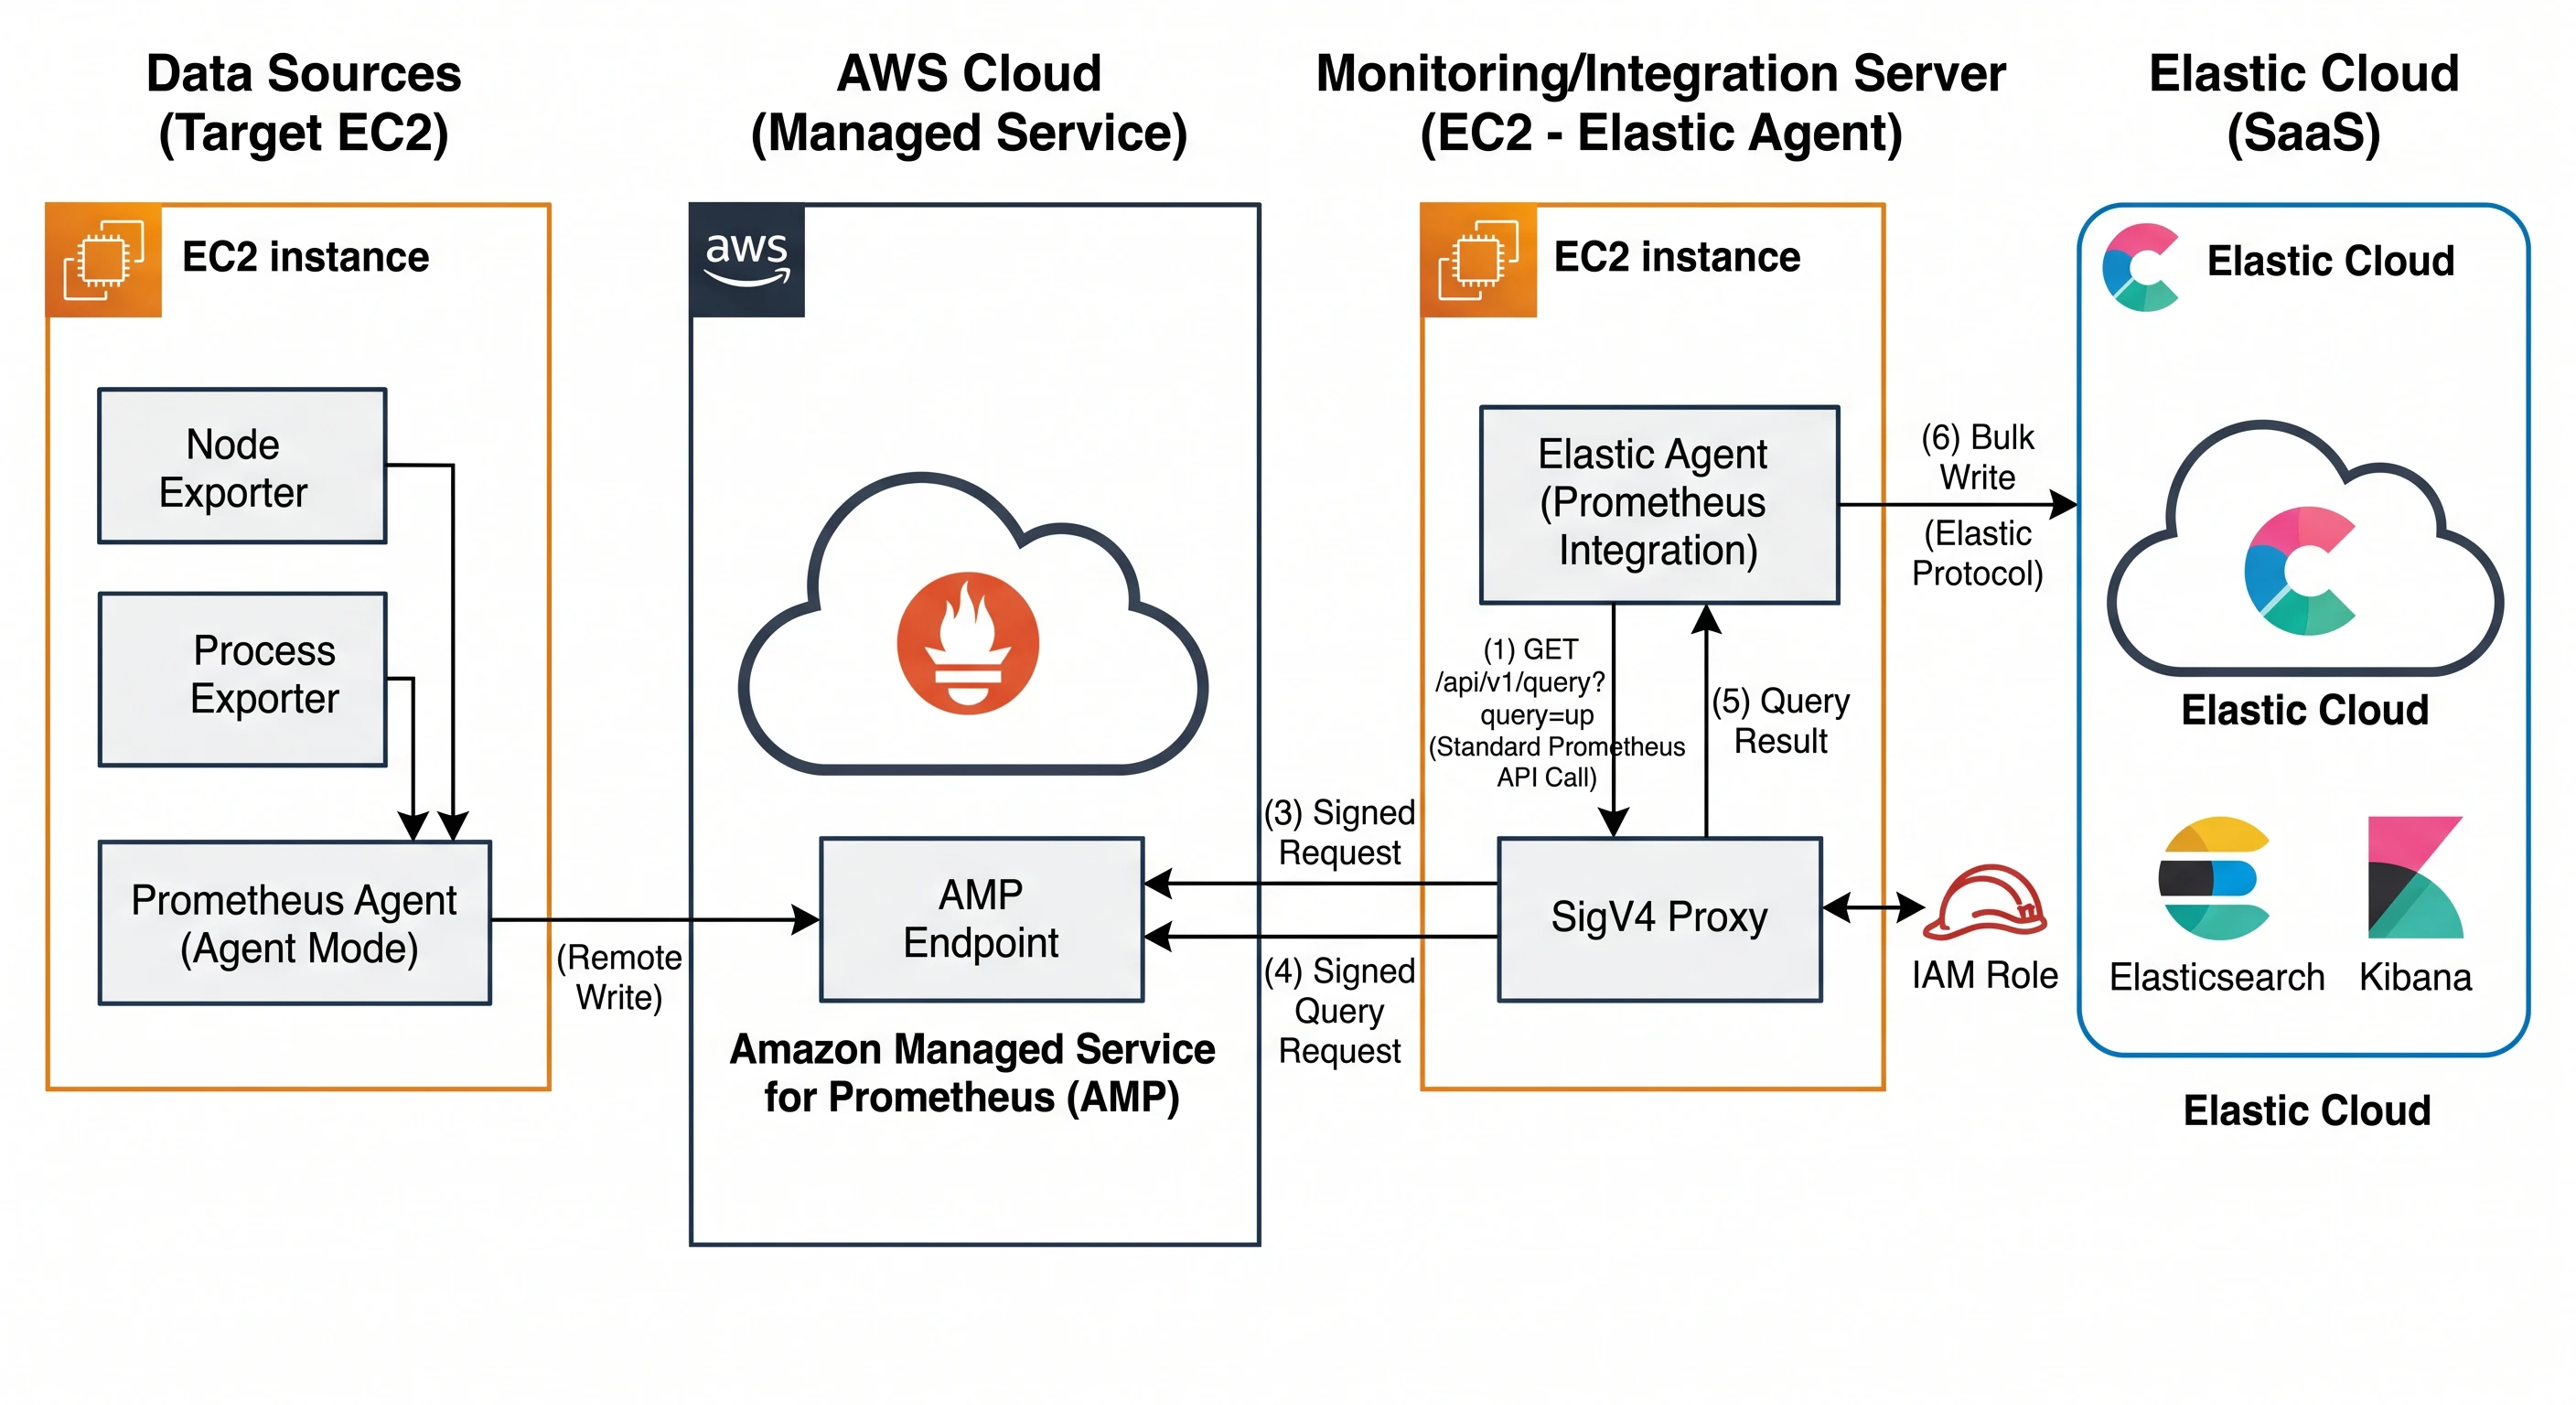
今回の記事では、Prometheus側のAMP、Prometheus Agent, exporterなどのセットアップは割愛します。(ほとんど生成AIに聞いてセットアップできました)
SigV4 Proxyのセットアップ
Elastic AgentがAMPにアクセスするにはSigV4 Proxyというのを間に入れる必要があります。
しかし、これがうまく動作するのに少し苦労しました。
SigV4 ProxyとしてDocker版をセットアップする手順が多いですが、Docker版だとHttpヘッダにHost=aps-workspaces.ap-northeast-1.amazonaws.comというのを入れる必要があったのですが、効かずにうまくいきませんでした。
docker run -d --name sigv4-proxy \
  -p 8080:8080 \
  -e AWS_REGION=ap-northeast-1 \
  public.ecr.aws/aws-observability/aws-sigv4-proxy:1.11.1 \
  --name aps \
  --host aps-workspaces.ap-northeast-1.amazonaws.com \
  -v
そこで以下の記事を参考に、Dockerではなくコードをダウンロードし、ビルドして起動するやり方だとうまくいきました。
https://qiita.com/atsusics/items/fe970368278298d69ee5
/usr/local/bin/aws-sigv4-proxy \
  --host=aps-workspaces.ap-northeast-1.amazonaws.com \
  --sign-host=aps-workspaces.ap-northeast-1.amazonaws.com \
  --region=ap-northeast-1 \
  --name=aps \
  --port=:8080
Elastic Agentの設定
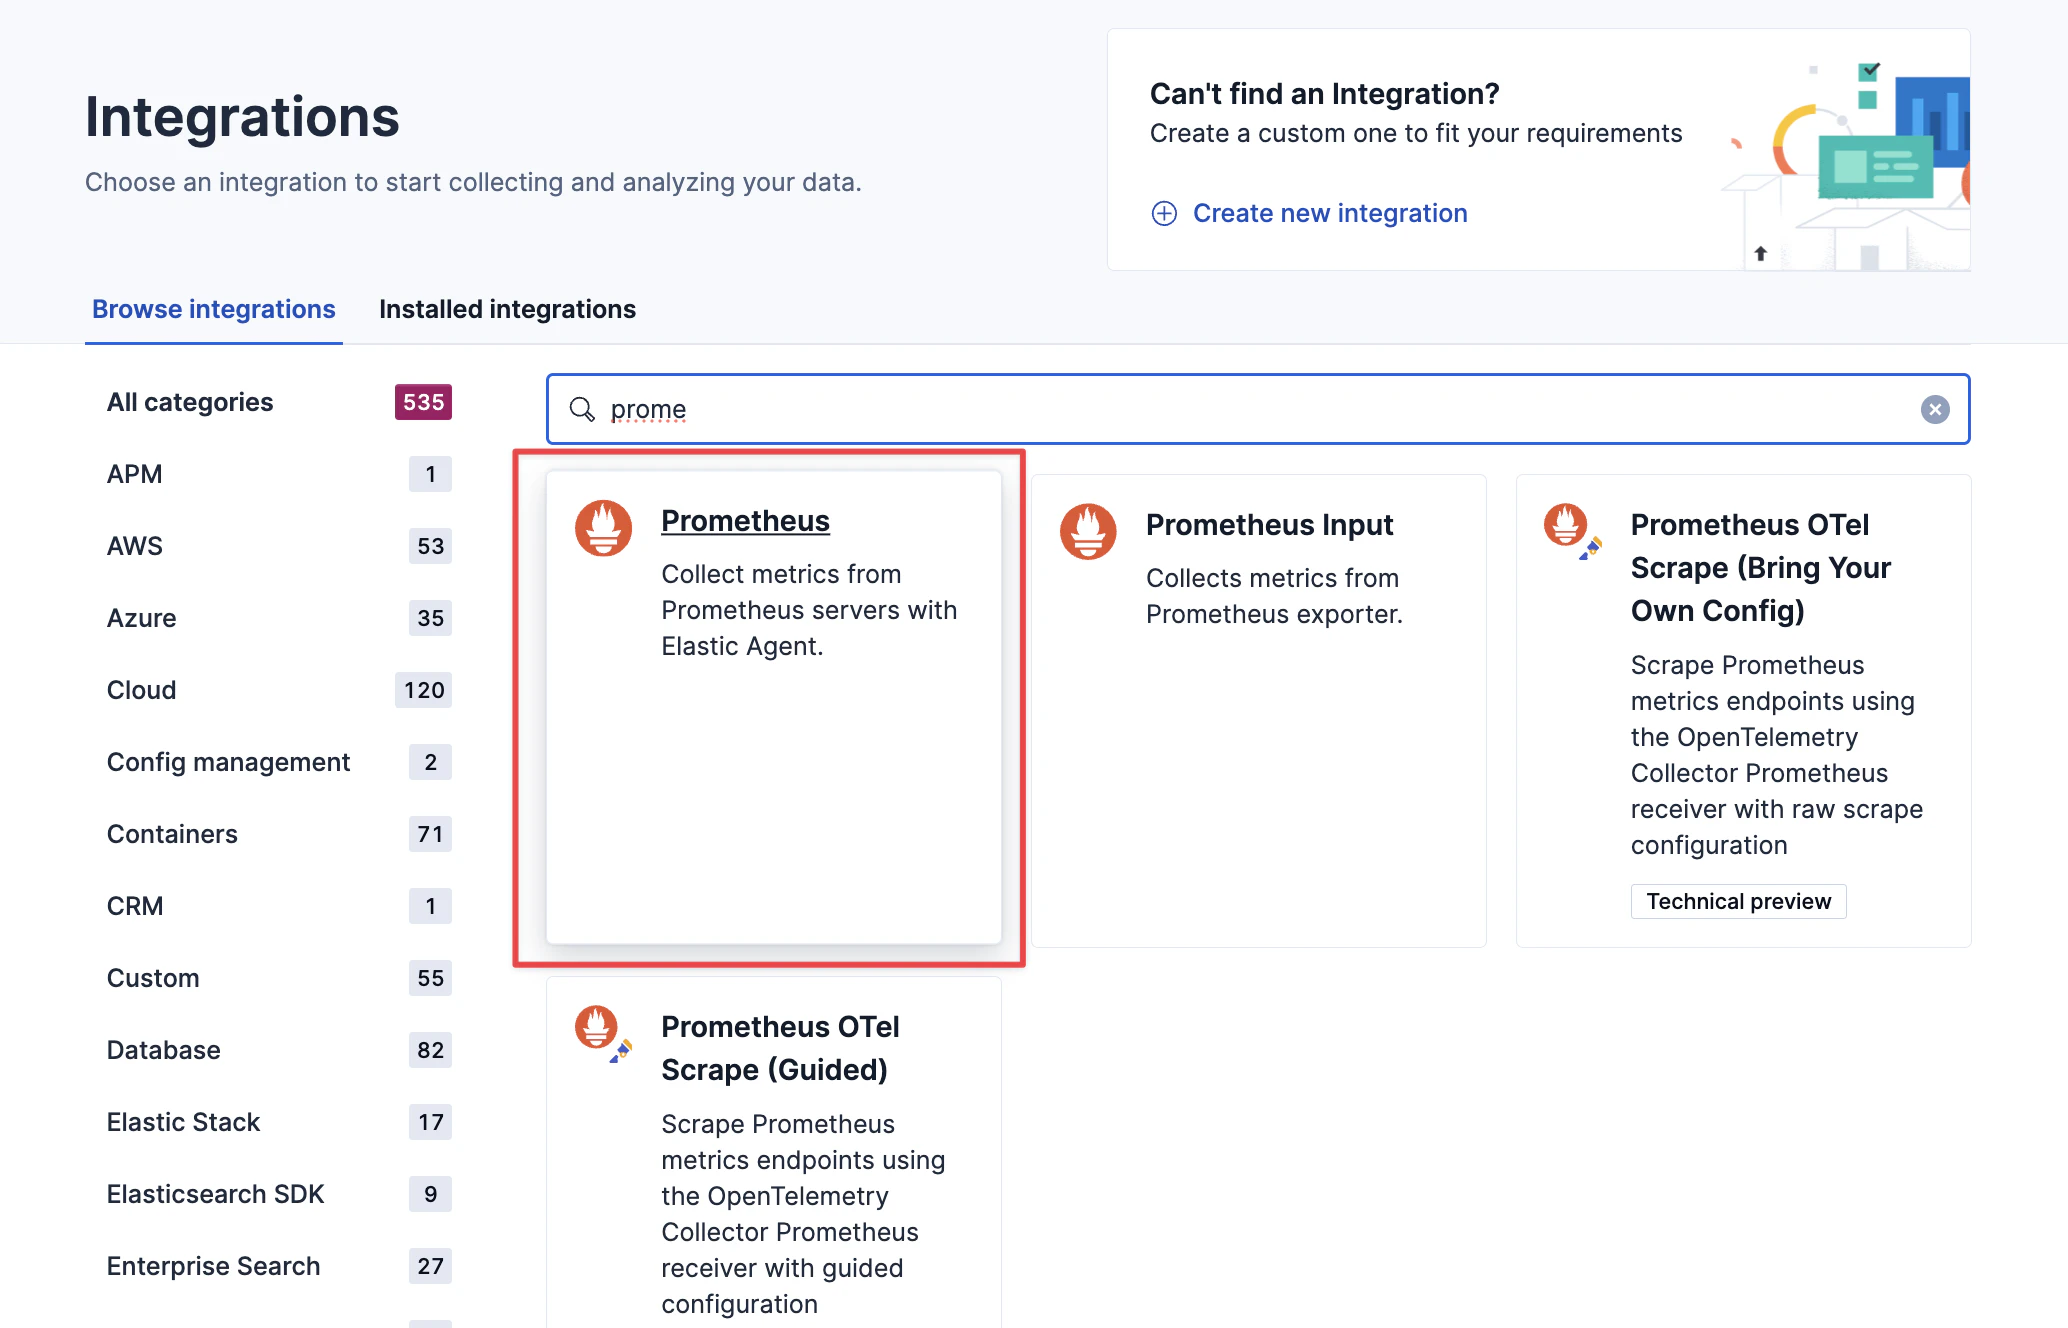
KibanaのWebUIから、IntegrationsメニューでPrometheus Integrationを使います。
いくつか設定項目がありますが、
Prometheus query metricsだけ有効にしています。
Prometheus remote write metrics や Prometheus collector metricsは無効のままです。
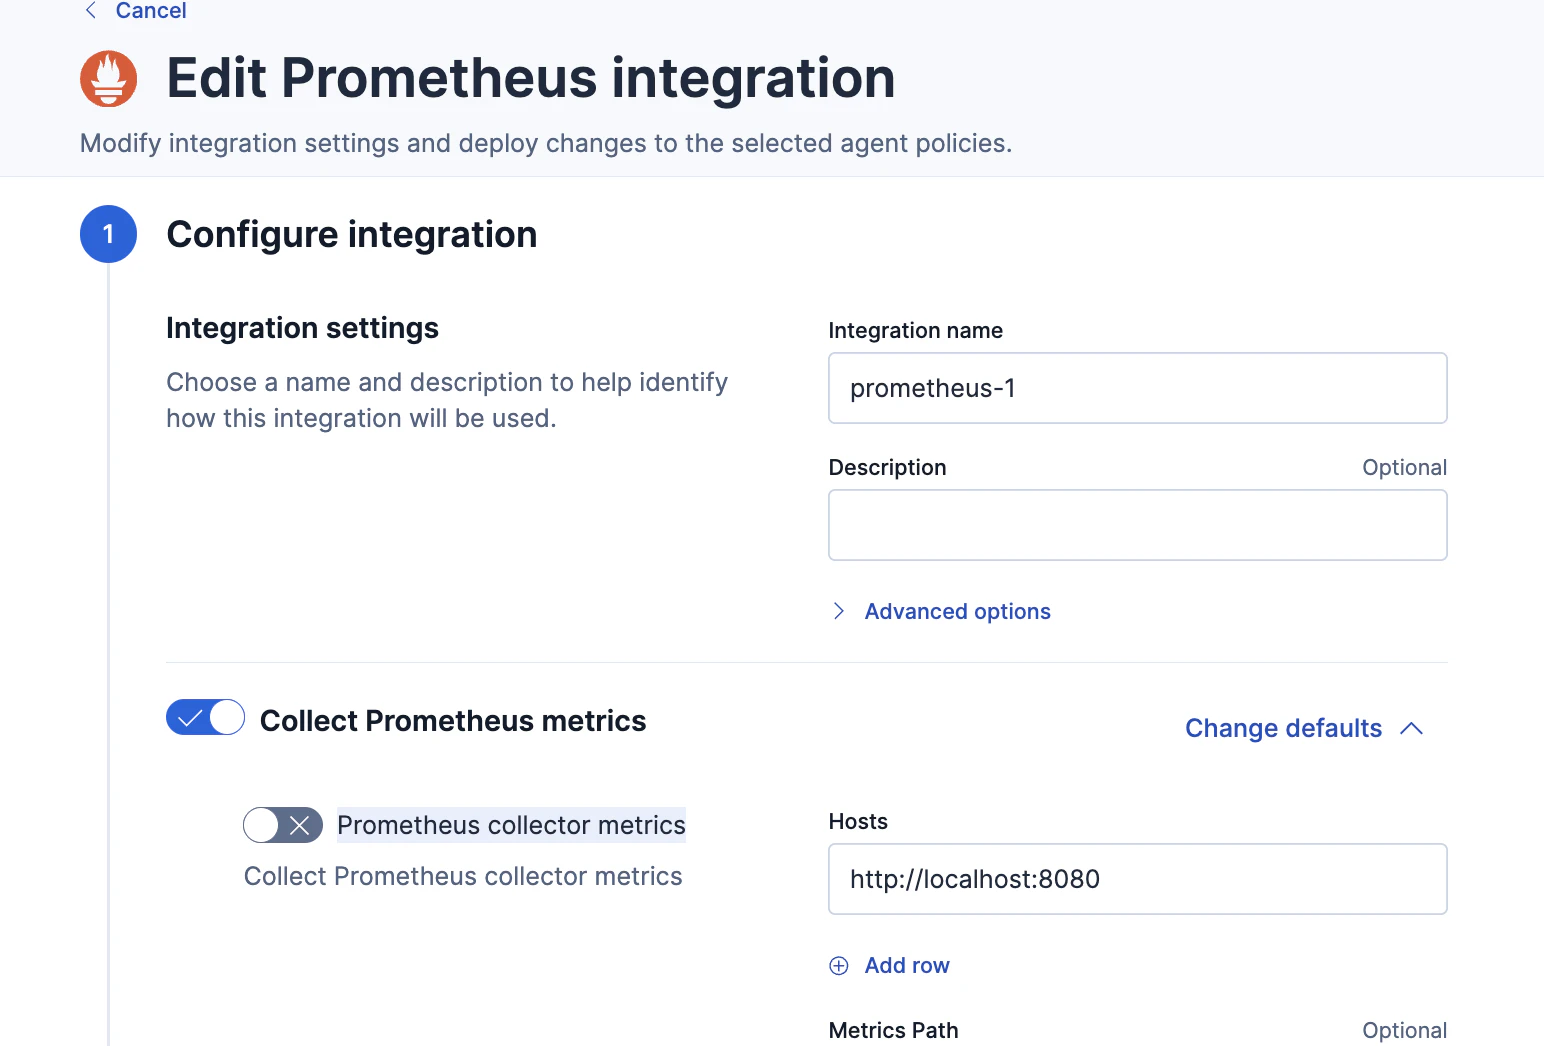
Prometheus query metricsのHostsの書き方がコツが要ります。URLパスでlocalhost:8080/workspaces/<AMP Workspace ID> のように書きます。

QueriesにはこのようにPromQLを書きます。

- name: cpu_usage_percentage
  path: /api/v1/query
  params:
    query: 100 - (avg by (instance) (rate(node_cpu_seconds_total{mode="idle"}[2m])) * 100)

- name: memory_usage_bytes
  path: /api/v1/query
  params:
    query: node_memory_MemTotal_bytes - node_memory_MemAvailable_bytes

- name: network_receive_bytes_rate
  path: /api/v1/query
  params:
    query: sum by (instance) (rate(node_network_receive_bytes_total[2m]))

- name: network_transmit_bytes_rate
  path: /api/v1/query
  params:
    query: sum by (instance) (rate(node_network_transmit_bytes_total[2m]))

- name: disk_io_time_rate
  path: /api/v1/query
  params:
    query: rate(node_disk_io_time_seconds_total[2m])

- name: process_cpu_usage_percentage
  path: /api/v1/query
  params:
    # 全CPUコアに対する使用時間(秒/秒)をレートで算出
    query: sum by (groupname, instance) (rate(namedprocess_namegroup_cpu_seconds_total[2m])) * 100

- name: process_memory_usage_bytes
  path: /api/v1/query
  params:
    query: namedprocess_namegroup_memory_bytes{memtype="resident"}

- name: process_disk_write_bytes_rate
  path: /api/v1/query
  params:
    query: sum by (groupname, instance) (rate(namedprocess_namegroup_write_bytes_total[2m]))
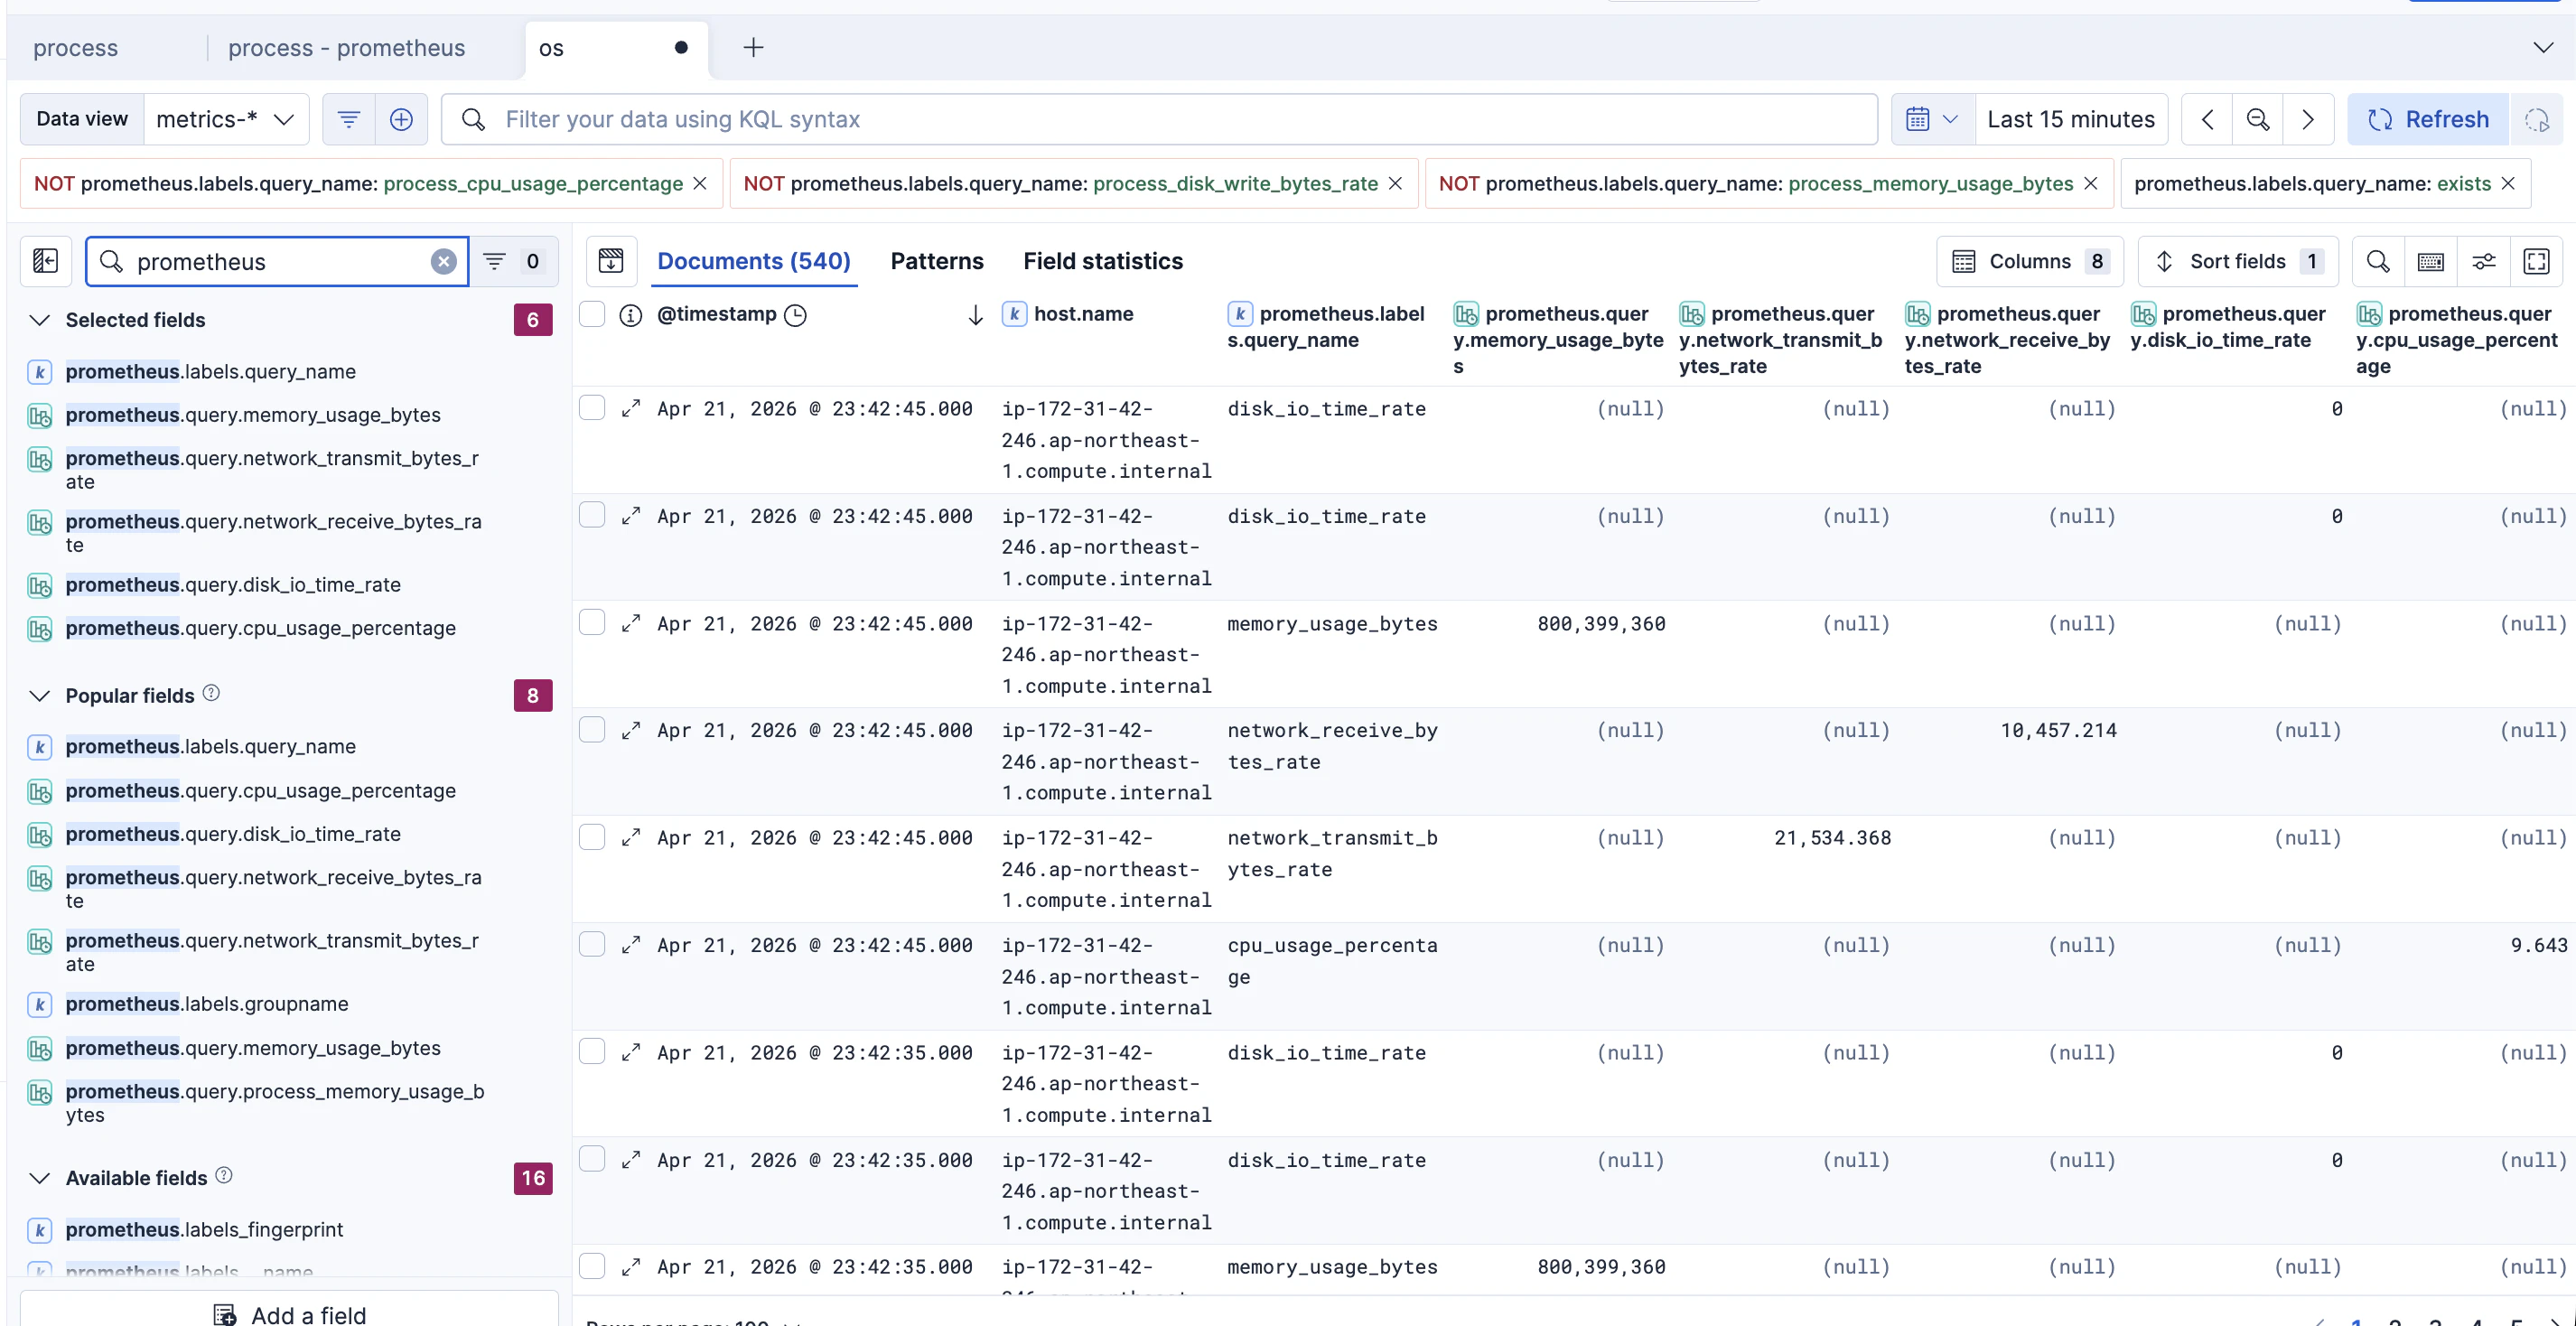
結果
このようにprometheus.xxxのフィールド名として各種メトリックが確認できます。
ダッシュボード作成はElastic Agent Skillsを利用して作成
ダッシュボードは一から作成する必要があり、これが一番大変です。
しかし、今の時代はElasticのAgent Skillsがあり、GitHub CopilotやClaude CodeなどがあればダッシュボードもLLMが作ってくれます。kibana-dashboardsというSkillを使います。もう一つ、elasticsearch-esqlというSkillも有効化して実施しています。
チャットの会話は全部載せられませんが、以下のような指示を与えてます。
Connect to Kibana: <私KibanaのURL> with username: elastic, password: <私のパスワード>KQL: prometheus.labels.groupname: exists のデータを見て、Prometheus integrationで収集したOSプロセスのメトリックのダッシュボードを作成してほしい。プロセス毎にCPUやメモリやDiskの指標が見えるようにして。Line chartのダッシュボードがほしいprocess nameをチェックして、elasticに関わるプロセスだけ表示するようにして
LLMが試行錯誤の結果、以下のダッシュボードを作ってくれました!すばらしい!

おわり
Elastic のPrometheus関連の連携機能が充実してきているので、今後も調査していきます。