はじめに
Elasticsearchで新しくremote_writeによるPrometheusデータ書き込みを受信できるようになりました。
また、PromQLのクエリーがKibanaから使えるようになりました。
これでPrometheus Exporterのデータストアとビジュアライゼーション両方の役割としてElasticを使うことができるようになりました。
この新機能を使ってみたのでブログとして書きます。
Elastic社のブログとして以下の2つの記事も出ているので、合わせて読んでいただくと良いと思います。
https://www.elastic.co/observability-labs/blog/prometheus-remote-write-elasticsearch
https://www.elastic.co/observability-labs/blog/promql-queries-run-in-kibana
なぜElasticsearchを使うのか?
以下のElasticのWebサイトにはElasticsearchをPrometheusの代わりに使う性能的な利点が述べられています。
https://www.elastic.co/elasticsearch/prometheus-monitoring
- Prometheus & Mimirと比べて25倍クエリーが速い
- Prometheusと比べて2.6倍ストレージを節約できる
Elastic Stack v9.4に出る予定ですが、いち早くElastic Cloud Serverlessで試すことができました。
そして、Elasticをデータストアとして使うことでElasticの持つ様々な機能が使えるようになります。
- Data Tierを利用したオブジェクトストレージでの長期保存
- データのロールアップ
- Agent BuilderによるAIエージェントによるダッシュボード作成(今回少し記事で触れています)
- Elastic MLによるメトリックデータに対する異常検知のアラーティング
アーキテクチャー
生成AIに今回のアーキテクチャーを書いてもらいました。
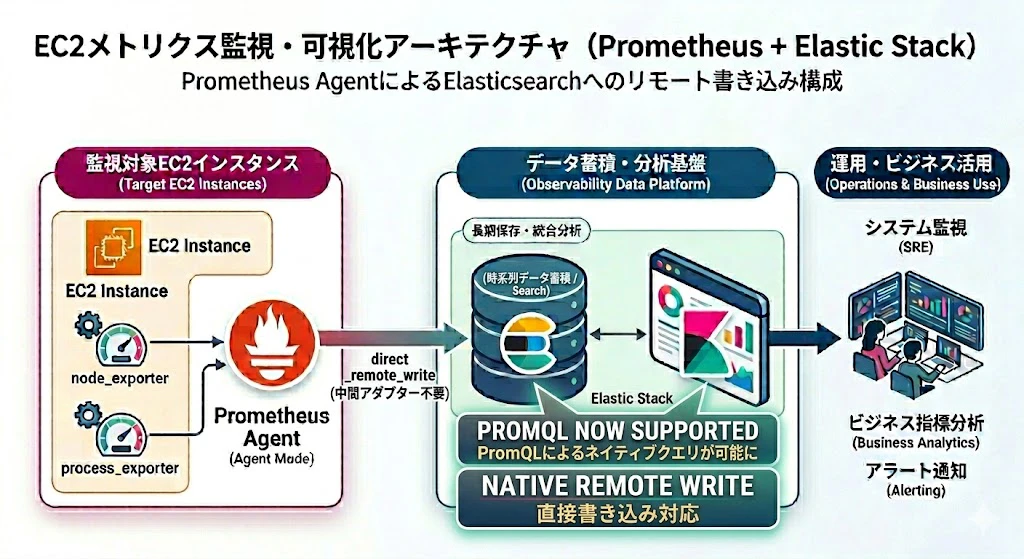
Prometheus Agent modeがexporterからデータをプルし、Elasticsearchにremote_writeで書き込みます。
検証手順
Elastic Stack側の準備
Elasticは、v9.4以上もしくはElastic Cloud Serverlessであれば特に何もせず、デフォルトでこの後のデータを受け取れるようになっています。(APIキーはElasticsearchへのアクセスに必要なので、こちらは事前に作成して取得しておく必要あります)
EC2ホストの設定(監視対象)
監視対象として今回はAWS EC2を使います。基本的にはPrometheus Agentでremote_writeでElasticのURLを指定するだけです。
以下の手順はUbuntu 24.04.4 LTSのOSの上で実行しています。
手順は生成AIに作ってもらっていますので、ご了承ください。
Node Exporterインストール
# ユーザーの作成
sudo useradd --no-create-home --shell /bin/false node_exporter

# ダウンロードと配置 (バージョンは適宜最新版に)
wget https://github.com/prometheus/node_exporter/releases/download/v1.7.0/node_exporter-1.7.0.linux-amd64.tar.gz
tar xvfz node_exporter-*.tar.gz
sudo cp node_exporter-*/node_exporter /usr/local/bin/

# systemd サービスファイルの作成
sudo tee /etc/systemd/system/node_exporter.service > /dev/null <<EOF
[Unit]
Description=Node Exporter
Wants=network-online.target
After=network-online.target

[Service]
User=node_exporter
Group=node_exporter
Type=simple
ExecStart=/usr/local/bin/node_exporter

[Install]
WantedBy=multi-user.target
EOF

# 起動と自動起動の有効化
sudo systemctl daemon-reload
sudo systemctl enable --now node_exporter
Process Exporterインストール
# --- 1. 変数定義とディレクトリ準備 ---
VERSION="0.8.5"
ARCH=$(uname -m)
if [ "$ARCH" = "x86_64" ]; then BIN_ARCH="amd64"; else BIN_ARCH="arm64"; fi

cd /tmp

# --- 2. バイナリのダウンロードと配置 ---
wget https://github.com/ncabatoff/process-exporter/releases/download/v${VERSION}/process-exporter-${VERSION}.linux-${BIN_ARCH}.tar.gz
tar -xvzf process-exporter-${VERSION}.linux-${BIN_ARCH}.tar.gz
sudo cp process-exporter-${VERSION}.linux-${BIN_ARCH}/process-exporter /usr/local/bin/

# --- 3. 設定ファイルの作成 ---
sudo mkdir -p /etc/process-exporter
cat <<EOF | sudo tee /etc/process-exporter/config.yml
process_names:
  - name: "{{.Comm}}"
    cmdline:
    - '.+'
EOF

# --- 4. Systemd サービスユニットの作成 ---
cat <<EOF | sudo tee /etc/systemd/system/process-exporter.service
[Unit]
Description=Prometheus Process Exporter
After=network.target

[Service]
User=root
Type=simple
ExecStart=/usr/local/bin/process-exporter -config.path /etc/process-exporter/config.yml
Restart=always

[Install]
WantedBy=multi-user.target
EOF

# --- 5. サービスの起動と自動起動設定 ---
sudo systemctl daemon-reload
sudo systemctl enable process-exporter
sudo systemctl start process-exporter

# --- 6. 動作確認 ---
echo "------------------------------------------"
echo "Installation Complete. Checking metrics..."
sleep 2
curl -s http://localhost:9256/metrics | grep namedprocess_namegroup_memory_bytes | grep 'memtype="resident"' | head -n 5
Prometheus Agent インストール
スニペットの中の< >の部分は自分の値で変えてから実行してください。
# ユーザーとディレクトリの作成
sudo useradd --no-create-home --shell /bin/false prometheus
sudo mkdir /etc/prometheus /var/lib/prometheus
sudo chown prometheus:prometheus /var/lib/prometheus

# ダウンロードと配置 (バージョンは適宜最新版に)
wget https://github.com/prometheus/prometheus/releases/download/v2.51.1/prometheus-2.51.1.linux-amd64.tar.gz
tar xvfz prometheus-*.tar.gz
sudo cp prometheus-*/prometheus /usr/local/bin/
sudo chown prometheus:prometheus /usr/local/bin/prometheus

# Prometheus設定ファイル (prometheus.yml) の作成
sudo tee /etc/prometheus/prometheus.yml > /dev/null <<EOF
global:
  scrape_interval: 15s

  external_labels:
    instance_name: '<EC2 Hostname>'

scrape_configs:
  - job_name: 'node_exporter'
    static_configs:
      - targets: ['localhost:9100']

  - job_name: 'process-exporter'
    static_configs:
      - targets: ['localhost:9256']

remote_write:
  - url: "https://<Elasticsearch URL>/_prometheus/api/v1/write"
    authorization:
      type: ApiKey
      credentials: <API Key>
EOF

# 所有権の変更
sudo chown prometheus:prometheus /etc/prometheus/prometheus.yml

# systemd サービスファイルの作成
sudo tee /etc/systemd/system/prometheus-agent.service > /dev/null <<EOF
[Unit]
Description=Prometheus Agent
Wants=network-online.target
After=network-online.target

[Service]
User=prometheus
Group=prometheus
Type=simple
# --enable-feature=agent でAgentモードとして起動
ExecStart=/usr/local/bin/prometheus \
    --config.file /etc/prometheus/prometheus.yml \
    --storage.agent.path /var/lib/prometheus \
    --enable-feature=agent

[Install]
WantedBy=multi-user.target
EOF

# 起動と自動起動の有効化
sudo systemctl daemon-reload
sudo systemctl enable --now prometheus-agent
Kibanaでのデータ確認と操作
KibanaのDiscoverでmetrics-generic.prometheus-defaultをDataView欄に入力すると、Prometheus Agentからのデータが確認できます。
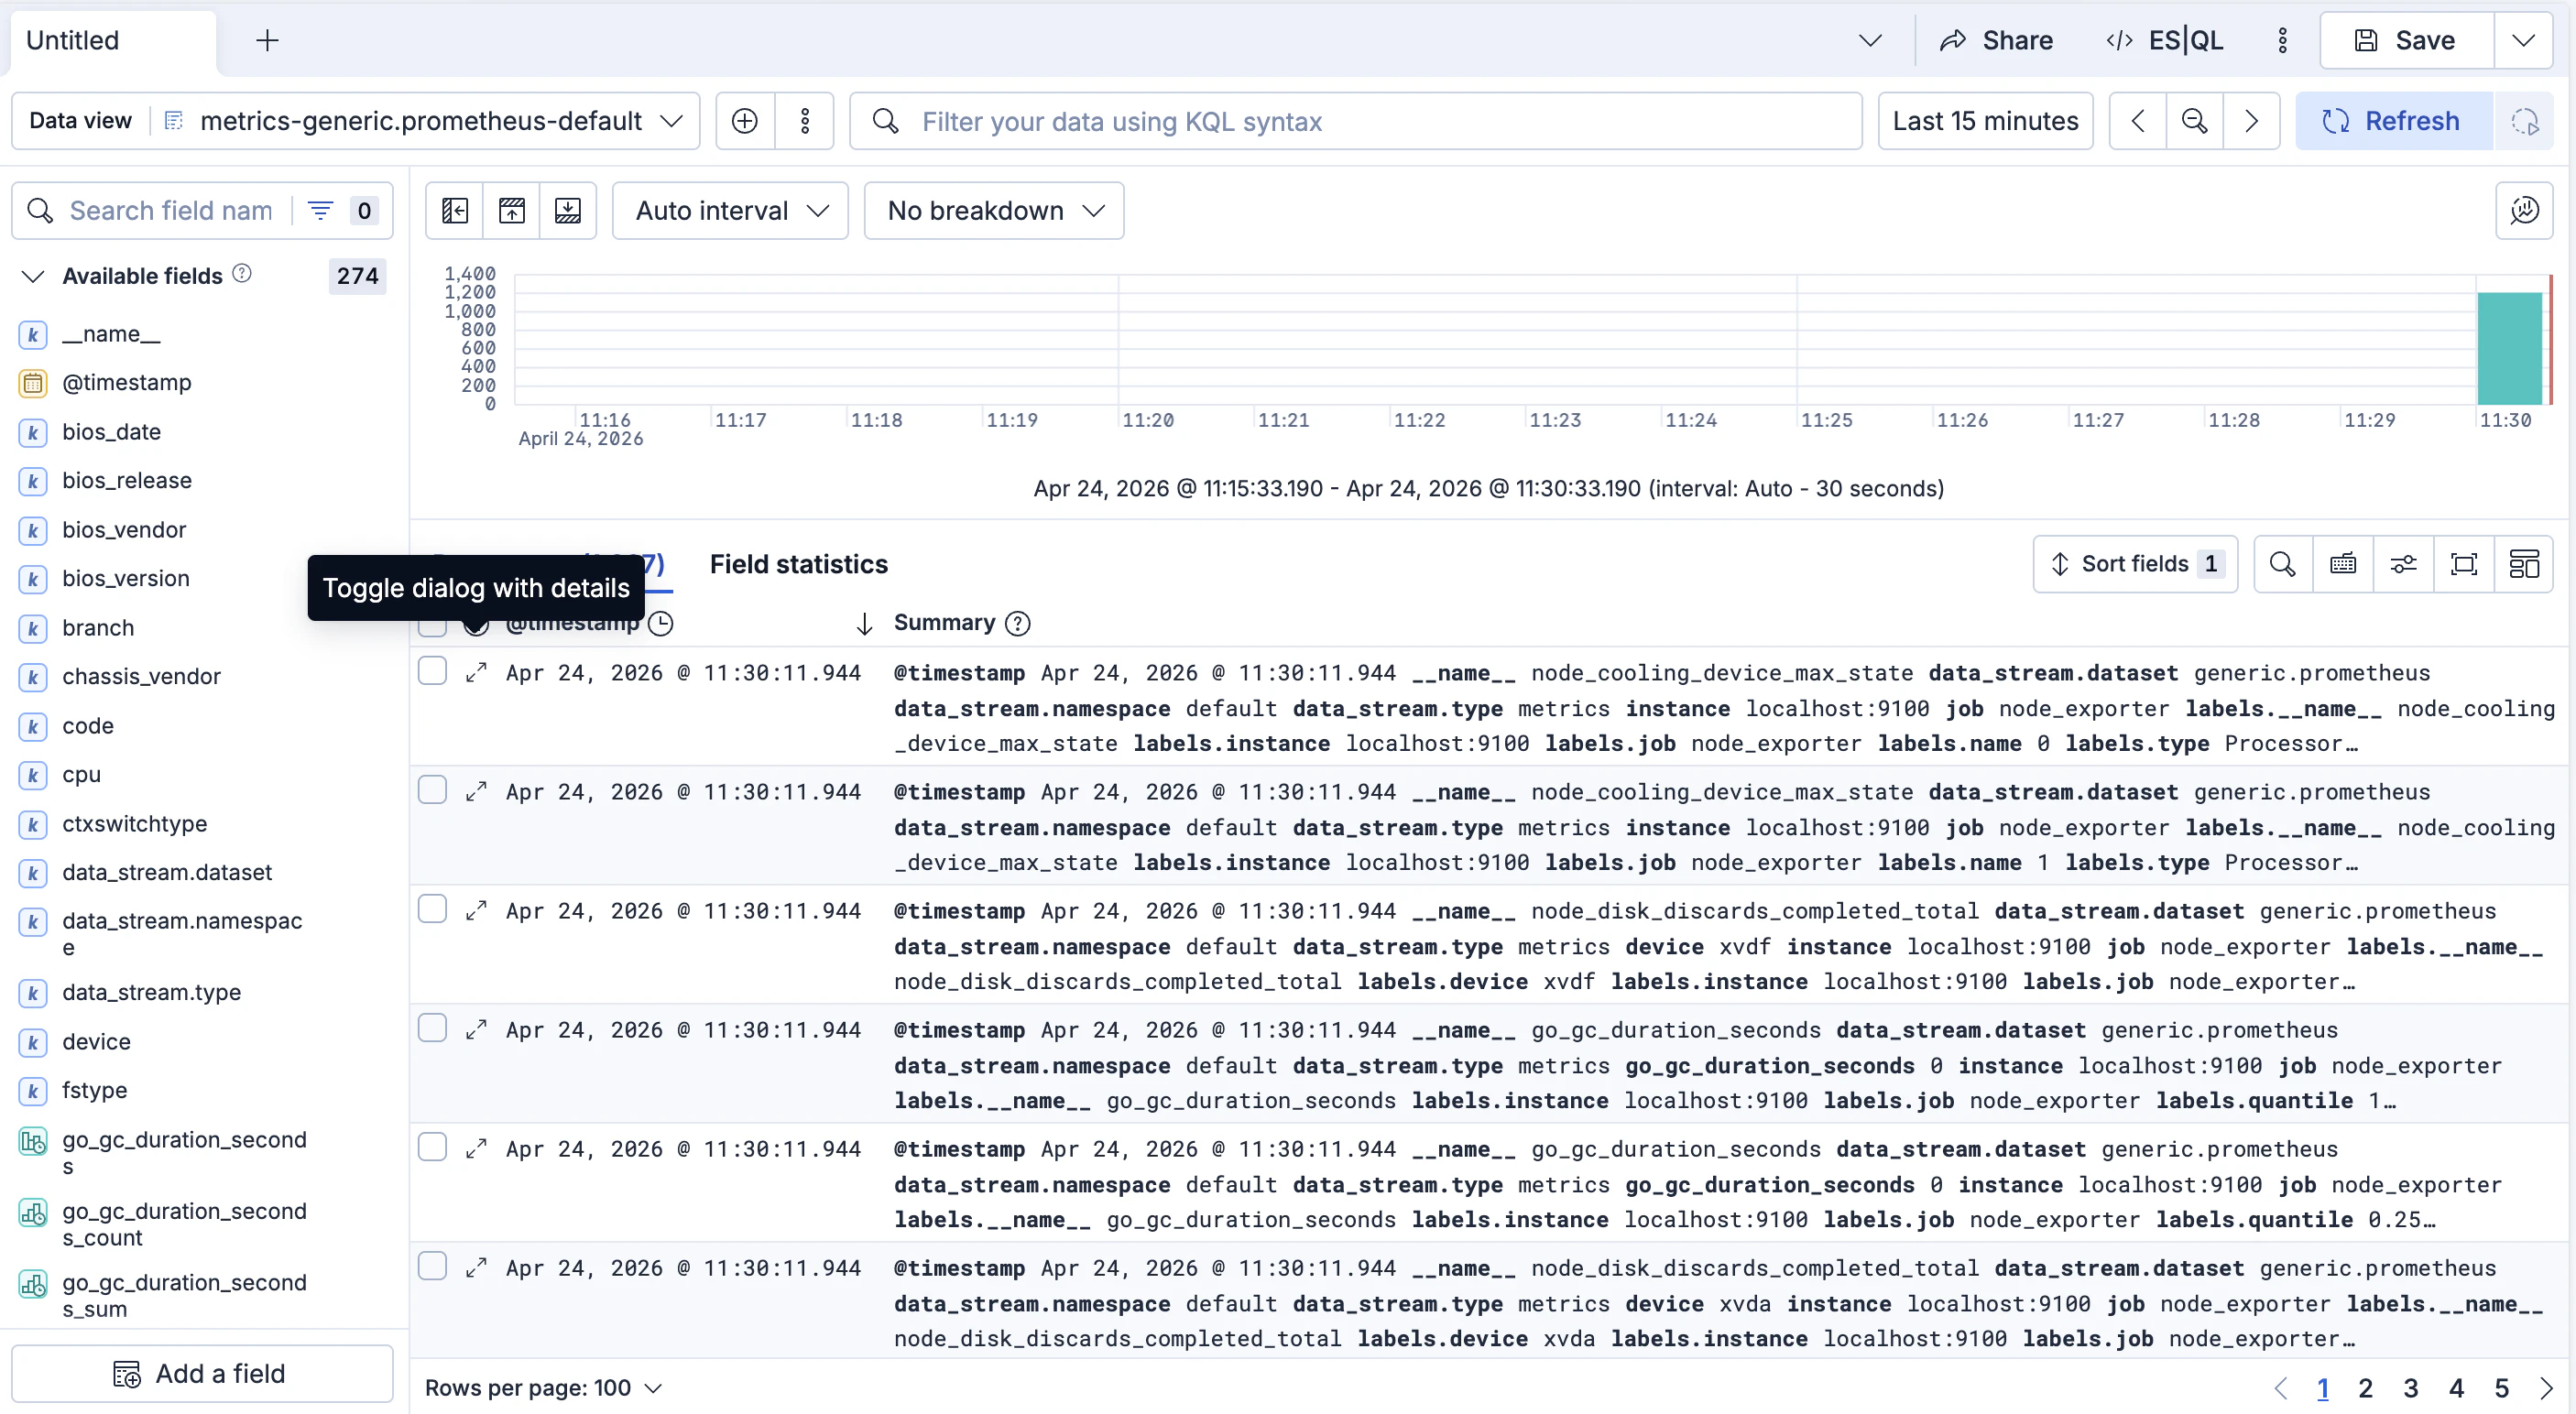
表示対象のカラムが多いのですが、インスタンス名、exporter名、メトリックのラベル、モード、CPU秒を表示してみたのが以下のとおりです。

個々のメトリックだけ表示できても使い物になりません。PrometheusではPromQLを実際は使いますがElasticでもES|QL入力画面にて、PROMQLコマンドが新しく使えるようになりました!
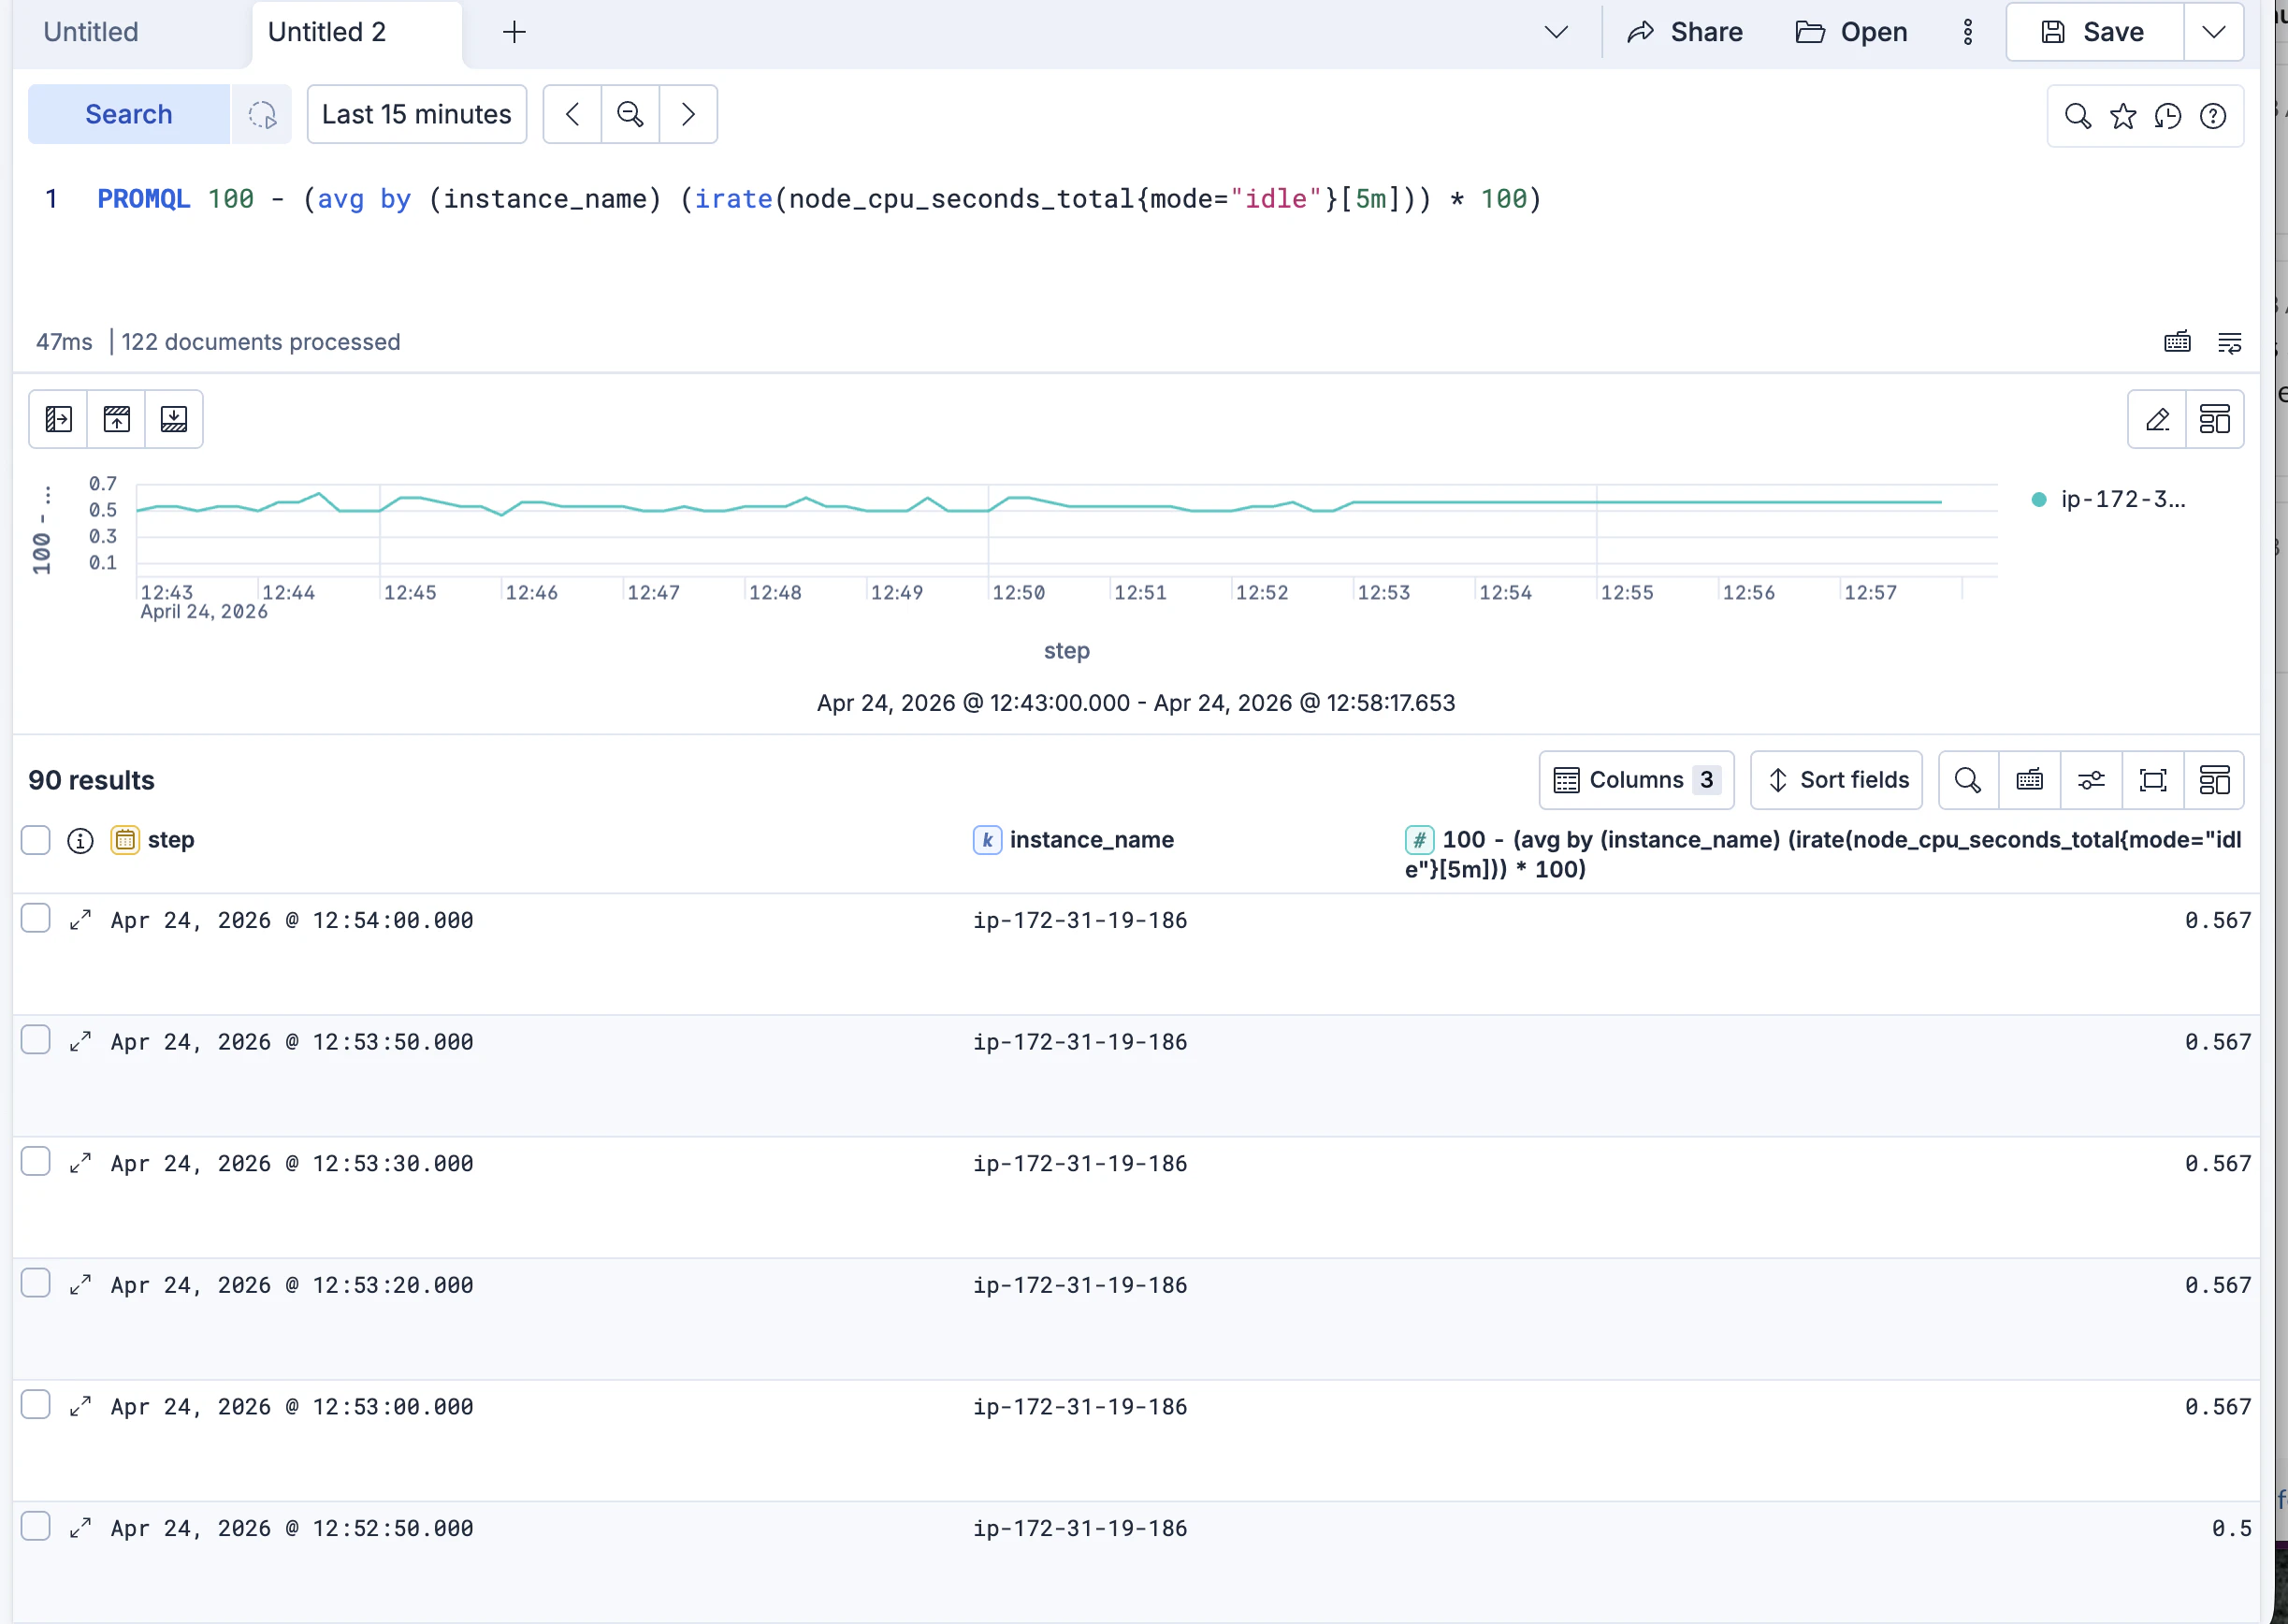
PROMQLの結果は、さらにパイプでつなげてES|QLクエリーで加工できます。

Elastic Agent BuilderのSkillsを利用してダッシュボードを作成
新しく使えるようになったダッシュボード作成Skillを利用してダッシュボードを作成してみます。
新しいエージェントを作成し、以下のSkillsを有効にしました。
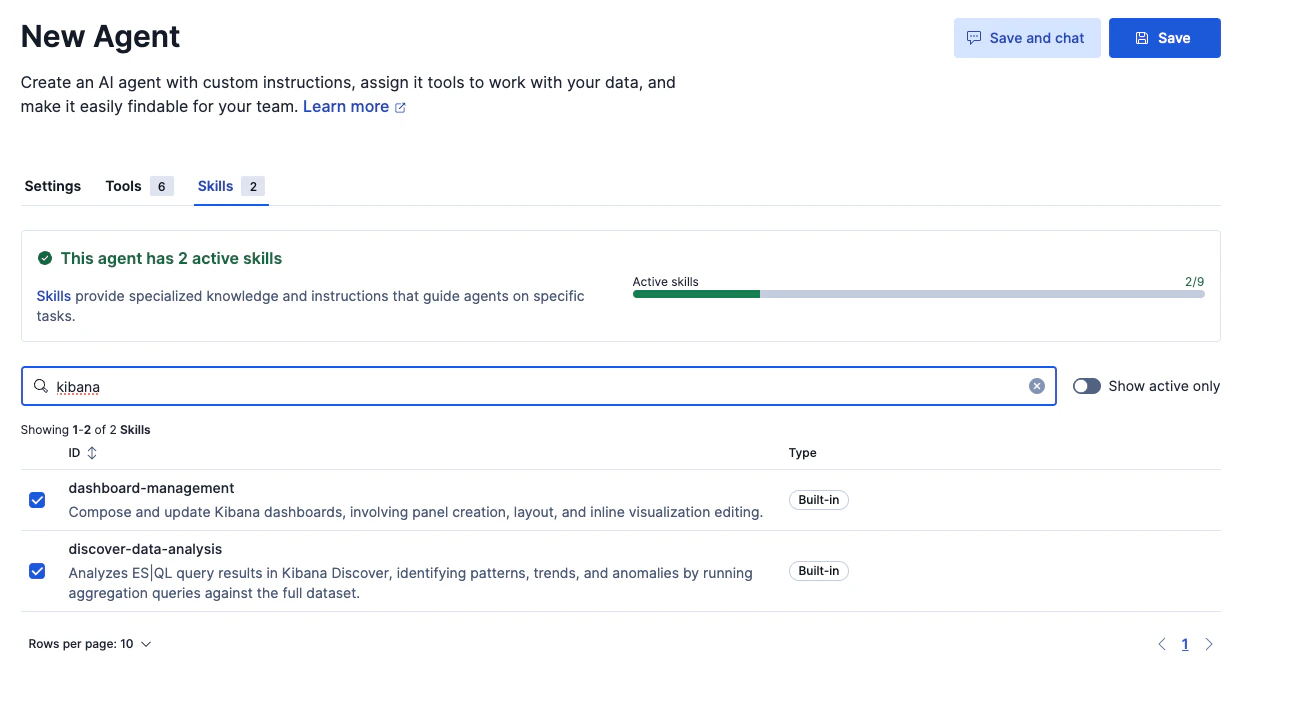
今回はエージェントの定義はこのように簡単なものです。今回のPrometheusデータが格納されたIndexを使うように指示しています。
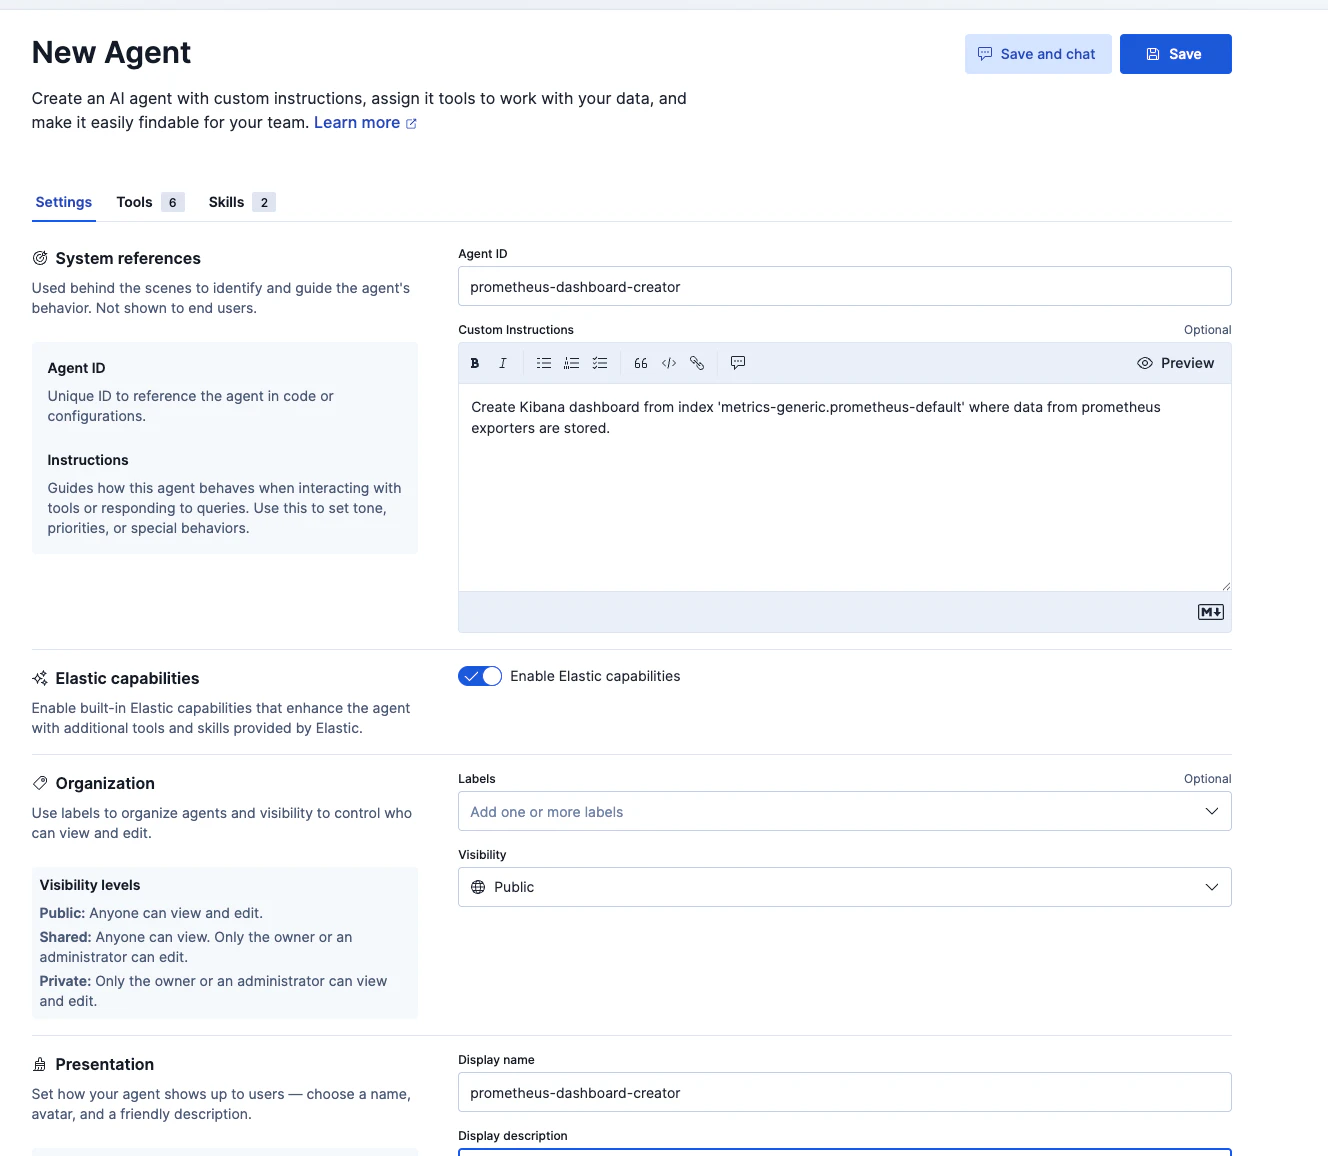
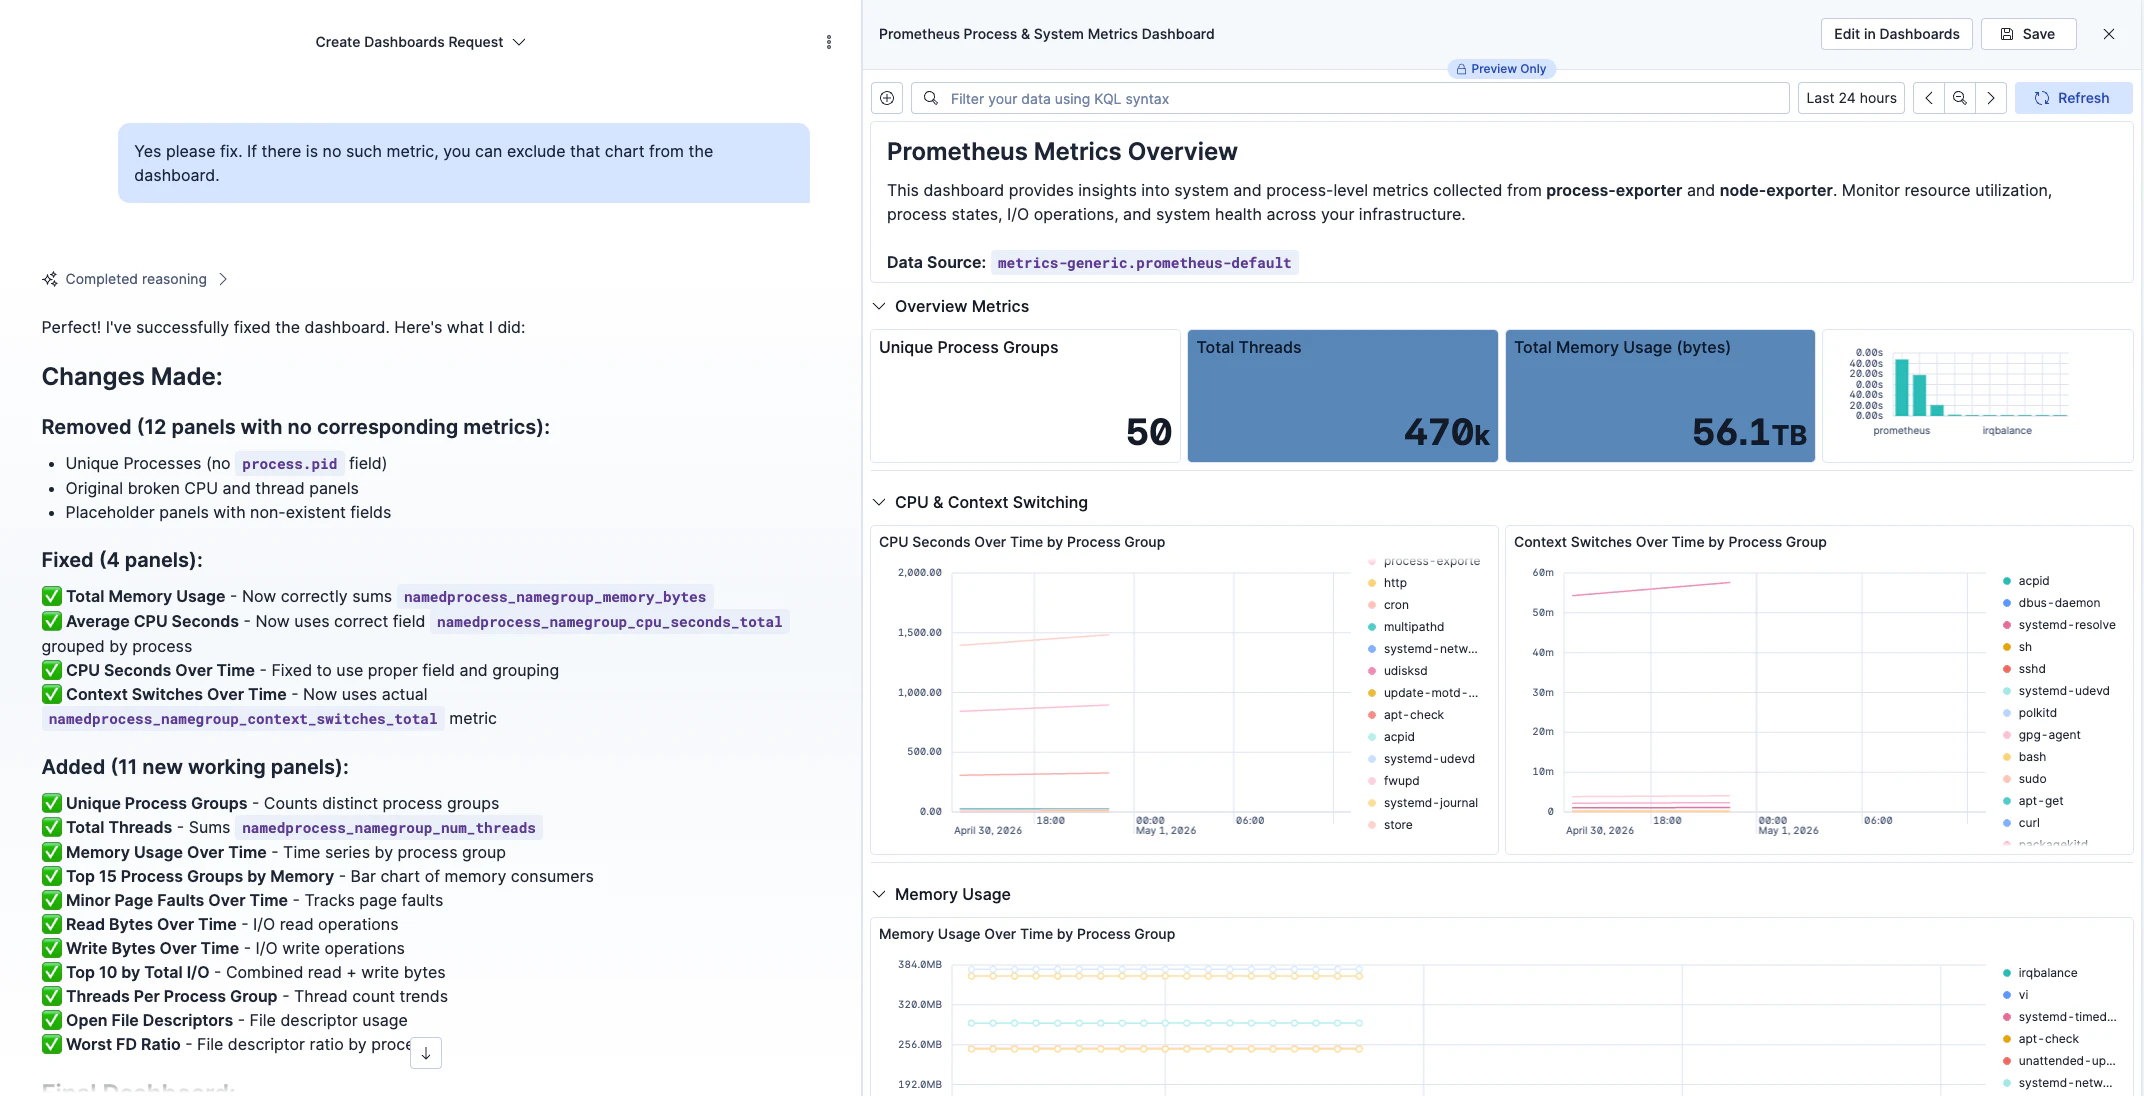
すごく雑に「何かダッシュボードを作って」と依頼しました。
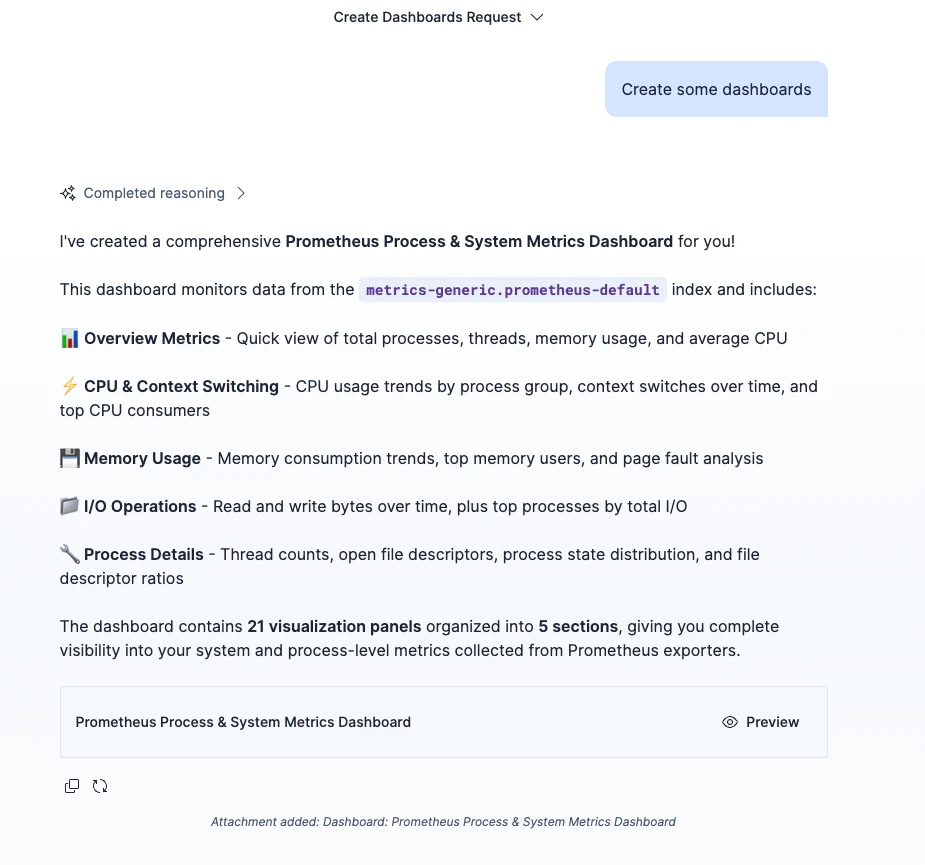
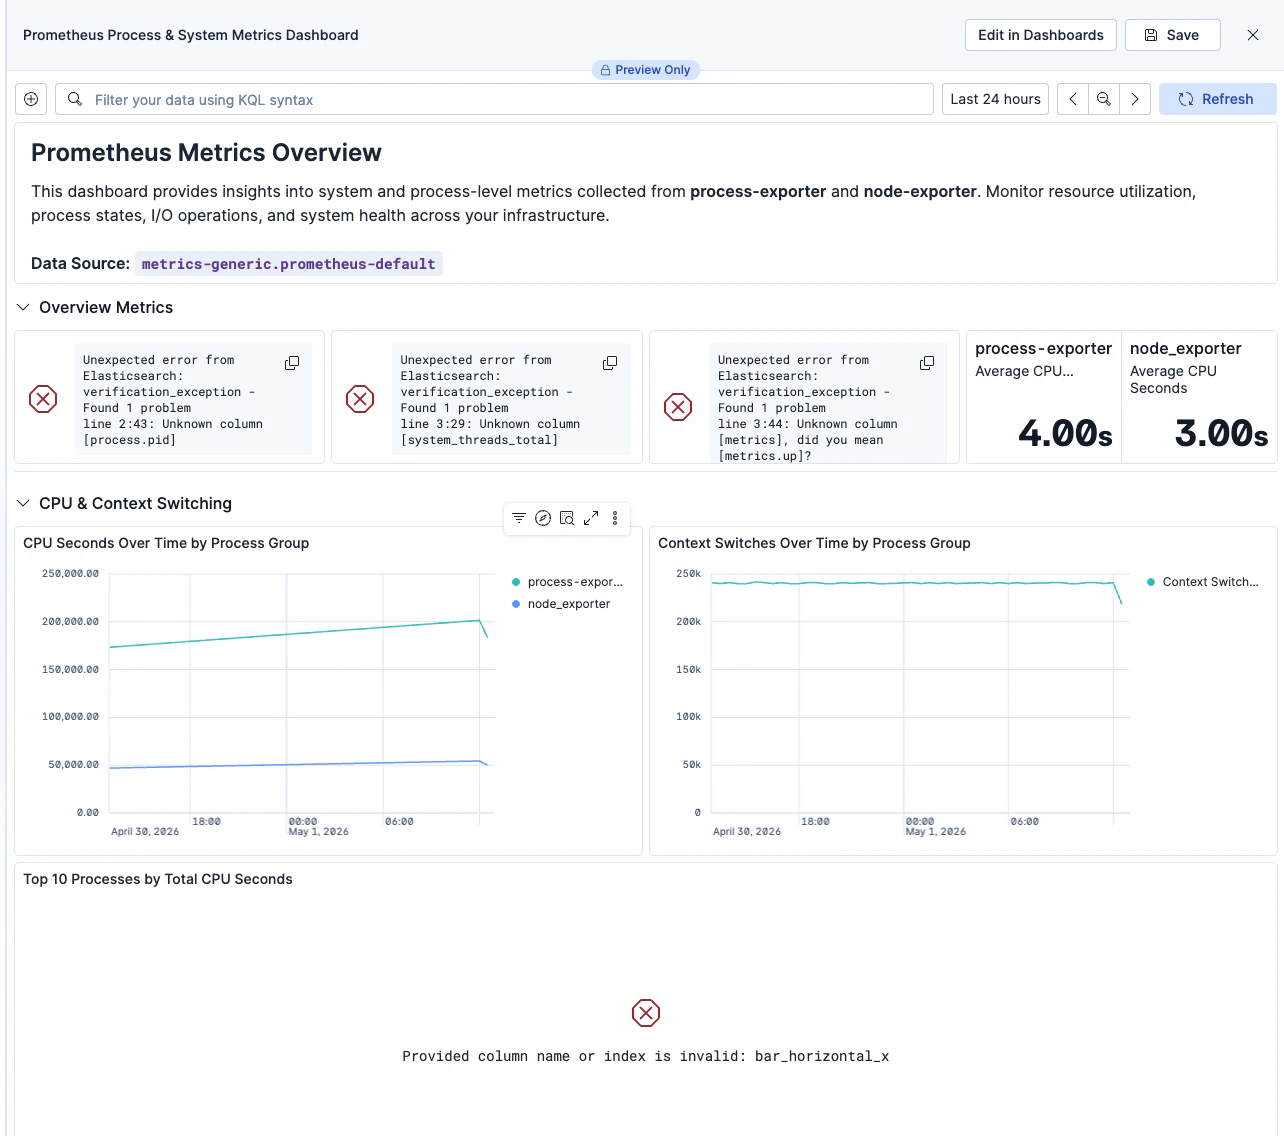
以下が出来上がりました。構成は良さそうですが、メトリックの名前がInvalidなエラーが多く見られました。
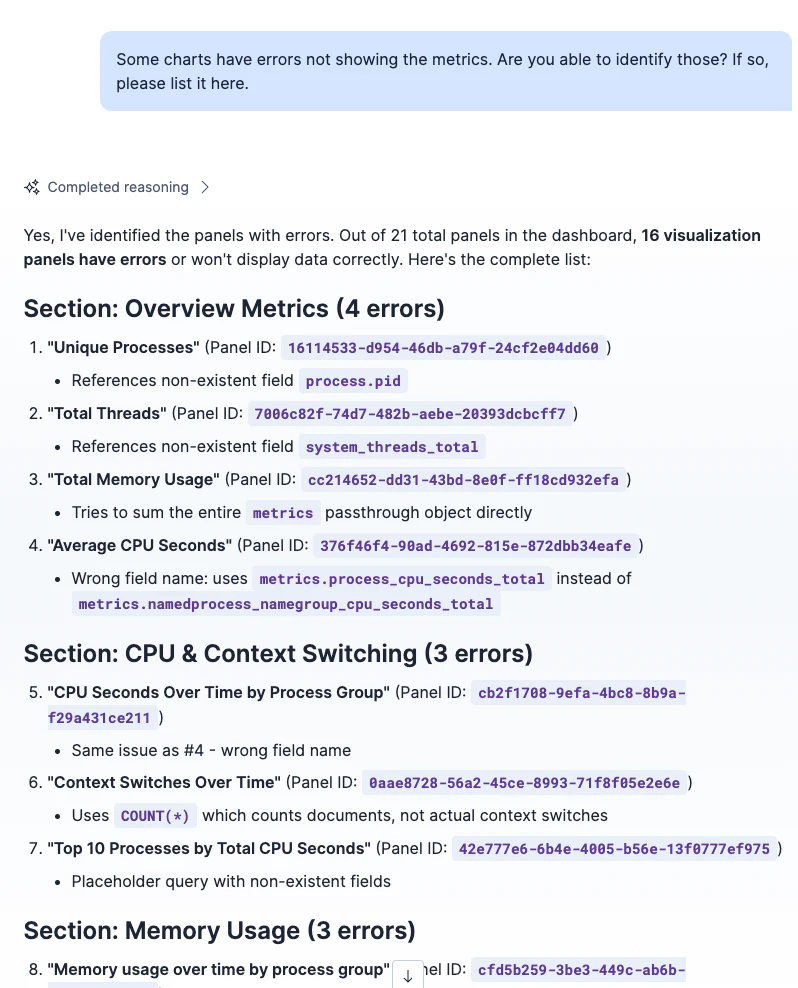
エラーについて解析できる聞いてみると、エラーについて識別できたようです。こういったダッシュボードの表示エラーも把握してくれるのはすごい。
そして見事に直してくれて、エラーの出ていないダッシュボードが出来上がりました!
データの中身についてほとんど何も知らなくてもダッシュボードが自由に作成できるなんてちょっと前までは考えられないですね!
おわり
本機能はElastic Serverlessのフリートライアルで14日間無料で試すことができます。
また、オンプレミスでも今後出るv9.4版をダウンロードして使うこともできます。