VyOSを運用していく中で、/var/log/messageをしばしば確認すると、SSHブルートフォースを被害を受けていることがわかった。よって、今回は対象のVyOSからSyslogを監視サーバ(Fluent,Elasticsearch,Kibana)に送信し、サーバ上で可視化することを目指したい。
なお、前回のGeoIPを利用するので、そちらの構築がまだの人は記事を参照してください。
以下のサイトを参考に作成しました。(ありがとうございます。)
はじめに
今回はVyOSの以下のようなsyslogはparseして詳細に可視化し、その他のsyslogに関しては表示するだけみたいな感じです。
Aug 27 14:52:15 vyos sshd[20938]: pam_unix(sshd:auth): authentication failure; logname= uid=0 euid=0 tty=ssh ruser= rhost=xxx.xxx.xxx.xxx  user=???
Aug 27 14:52:24 vyos sshd[20938]: PAM 2 more authentication failures; logname= uid=0 euid=0 tty=ssh ruser= rhost=xxx.xxx.xxx.xxx  user=???
Syslog監視サーバーの構築
はじめに今回新しく使用するFluendのプラグインをインストールしていきます。
ちなみに、syslogを受信するプラグインはデフォルトで入っていました。
受信したsyslogを解析するためのプラグインである、fluent-plugin-parserのインストール
$ sudo /opt/td-agent/embedded/bin/fluent-gem install fluent-plugin-parser
受信したsyslogを複数解析(通常だと1つ)するためのプラグインである、fluent-plugin-multi-format-parserのインストール
$ sudo /opt/td-agent/embedded/bin/fluent-gem install fluent-plugin-multi-format-parser
FluentdのconfファイルにSyslogの受信とparser(解析)の設定を書く
$ sudo vim /etc/td-agent/td-agent.conf
--省略--

<source>
  type syslog
  port 42185
  format none
  tag raw.syslog.event
</source>

<match raw.syslog.**>
  @type parser
  format multi_format
  remove_prefix raw
  add_prefix geo
  <pattern>
    format /^(?<time>[^ ]* [^ ]* [^ ]*) (?<host>[^ ]*) (?<ident>[a-zA-Z0-9_\/\.\-]*)(?:\[(?<pid>[0-9]+)\]): (?<message>.*); logname=(?<logname>[^ ]*) uid=(?<uid>[^ ]*) euid=(?<euid>[^ ]*) tty=(?<tty>[^ ]*) ruser=(?<ruser>[^ ]*) rhost=(?<rhost>[^ ]*)  user=(?<user>[^ ]*)$/
    time_format %b %d %H:%M:%S
  </pattern>
  <pattern>
    format syslog
  </pattern>
  #format syslog
  key_name message
</match>

<match geo.syslog.**>
  type geoip
  geoip_lookup_key rhost
  <record>
    geoip_country ${country_code['rhost']}
    geoip_city ${city['rhost']}
    geoip_lat ${latitude['rhost']}
    geoip_lon ${longitude['rhost']}
    geoip_pin ${latitude["rhost"]},${longitude["rhost"]}
  </record>
  remove_tag_prefix geo.
  add_tag_prefix es.
  skip_adding_null_record
</match>

<match es.syslog.**>
  type elasticsearch
  host localhost
  port 9200
  type_name syslog
  logstash_format true
  logstash_prefix syslog
  logstash_dateformat %Y%m%d
  flush_interval 10s
</match>
簡単に解説すると、
部分でsyslogを受信する設定(待ち受けポート番号:42185)を書き。 部分で、受信したsyslogでsshのlogにマッチするもの(正規表現を利用)とその他のlogを解析しています。 ちなみに正規表現のデバックは、[http://fluentular.herokuapp.com](http://fluentular.herokuapp.com)が最強です。 部分で、sshのlogにおけるrhost(リモートホストのIPアドレス)をgeoidによる解析をして、位置情報を解析しています。その他のsyslogはスキップです。 部分で、これらのデータをelasticsearchに送信している感じです。Geoip(geoip_pin)を利用していますので、受信するsyslogのIndexに"type" : "geo_point"のフォーマットを追加しましょう.
$ curl -XPUT http://localhost:9200/_template/syslog -d '
{
  "template" : "syslog-*",
  "mappings" : {
    "syslog" : {
      "properties" : {
        "@timestamp" : {
          "type" : "date",
          "format" : "dateOptionalTime"
        },
        "geoip_pin" : {
          "type" : "geo_point"
        }
      }
   }
  }
}'
以上、fluend(td-agent)を再起動する
$ /etc/init.d/td-agent restart
正しく動いているか念のため確認しておきましょう
$ tailf /var/log/td-agent/td-agent.log
これでサーバ側の準備はOKですが、syslogはIndexがガンガン溜まっていくので定期的に削除するようにしておきましょう。
以前に使ったcuratorを使っていきます。10日前のIndexはクローズ、20日前のIndexは削除していく設定は以下です。
$ vim ~/.curator/close_delete_indices.yml

---
# Remember, leave a key empty if there is no value.  None will be a string,
# not a Python "NoneType"
#
# Also remember that all examples have 'disable_action' set to True.  If you
# want to use this action as a template, be sure to set this to False after
# copying it.
actions:
  1:
    action: delete_indices
    description: >-
      Delete indices older than 20 days (based on index name), for syslog-
      prefixed indices. Ignore the error if the filter does not result in an
      actionable list of indices (ignore_empty_list) and exit cleanly.
    options:
      ignore_empty_list: True
      disable_action: False
    filters:
    - filtertype: pattern
      kind: prefix
      value: syslog-
    - filtertype: age
      source: name
      direction: older
      timestring: '%Y%m%d'
      unit: days
      unit_count: 20
  2:
    action: close
    description: >-
      Close indices older than 10 days (based on index name), for syslog-
      prefixed indices.
    options:
      ignore_empty_list: True
      delete_aliases: False
      disable_action: False
    filters:
    - filtertype: pattern
      kind: prefix
      value: syslog-
    - filtertype: age
      source: name
      direction: older
      timestring: '%Y%m%d'
      unit: days
      unit_count: 10
crontabに以下を登録しておきましょう
0 12 * * 1 curator ~/.curator/close_delete_indices.yml
VyOSの設定
VyOSは以下のわずかな設定のみです。facility,levelの知識は各自で深めてみてください。
# 設定モードに入る
configure

# syslogサーバの指定、facility(送るlogの選択)、level(送るlogの重要度的な)
set system host 192.168.1.100:42185 facility all level notice

# 変更のコミットおよび設定保存
commit
save
動作確認
Indexがきちんと作成されているか確認
$ curl -XGET 'localhost:9200/_cat/indices?v&pretty'
syslogのIndexがしっかりと構成されているか確認
$ curl "http://localhost:9200/syslog-yyyymmdd/_search?pretty"
監視画面の作成
まずsyslogのIndexを登録します。

これでDiscoverを開けば、syslogの監視(sshのlogはgeoip等の情報を付加)したものが見れると思います。

次にVisualizeの作成です。
はじめに、Data tableを作ります。
見にくいですが、以下のような設定です。
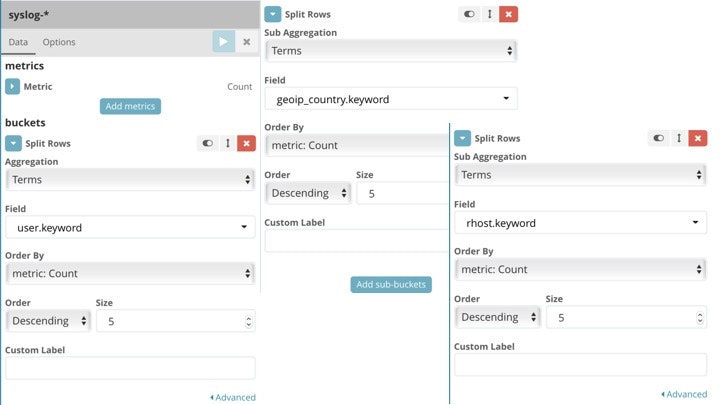
作成すると、sshアクセスした来た際に指定したユーザ、送信元IPアドレス、送信元の国、その回数を表に可視化できます。
ヒートマップはサクッとこんな感じです。

これで完了です。正規表現を利用したり、parseの仕方を勉強することで、様々なログ監視ができそうですね。