前回,コラージュテンプレート自動生成という記事を書いた.コラージュというのは一つの応用例で,「1つの領域をn個の領域に確率的に分割する方法」という方が正しい.
今回は,これの逆みたいなもので,n個の長方形(例えば画像)が与えられた時,それを$h \times w$の領域(以下キャンバスという)にいい感じに配置する手法というのを考えてみようと思う.
さて,今回も確率的な手法を使う.
長方形というのは一様分布で表すことができる.
例えば,$1 \times 1$のキャンバスを表す一様分布は以下の図のようになる.
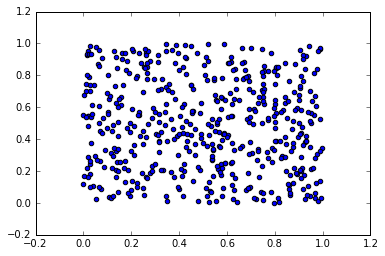
配置する長方形も一様分布で表現できるので,キャンバスを表す一様分布と,配置する長方形たちを表す一様分布のmixtureをマッチングさせればいい気がする.確率密度関数間の距離みたいなものを測るにはダイバージェンスが使える.今回はKLダイバージェンスを採用する.こうすると,mixtureを最尤推定していることになる.
さて,長方形は一様分布で表すことができると書いたが,最適化においてこれはあまり都合がよくない.なので,Gaussianで近似しようと思う.
配置する長方形たちを,$\{(h_i, w_i)\}_{i=1}^n$とする.
ただし,$h_i, w_i$はそれぞれ長方形$i$の縦幅と横幅を表しているとする.
長方形$i$を表す確率分布の密度関数を$N(x; \mu_i, \Sigma_i)$とする(Nは正規分布の意味).ここで,$\Sigma_i$を以下のように定義する.
\Sigma_i = \left[\begin{array}{ll}
\frac{h_i}{2} & 0 \\
0 & \frac{w_i}{2}
\end{array}\right]
これで,この分布は画像を近似的に表すようになった.
あとは$\mu_i$を推定するだけだ.キャンバスを表す分布の確率密度関数を$p(x)$とし,配置する長方形のmixtureを$q(x) = \sum_{i=1}^n w_i N(x; \mu_i, \Sigma_i)$,ただし,$\sum_{i=1}^n w_i = 1$とする.今回はclass priorは一様だとする,つまり,$w_i = \frac{1}{n}$.
さて,$p, q$間のKLダイバージェンスは以下のように表される.
\begin{align*}
KL(p||q) &= \int p(x) \log \frac{p(x)}{q(x)} dx \\
&\approx - \frac{1}{m} \sum_{j=1}^m \log q(x_j)
\end{align*}
最後は$x_j \sim p(x)$としてサンプル近似した.これを,長方形がはみ出ない,かつかぶらないという制約も課して最小化する.最適化にはscipy.optimize.minimizeを使う.多分projected gradient descent.
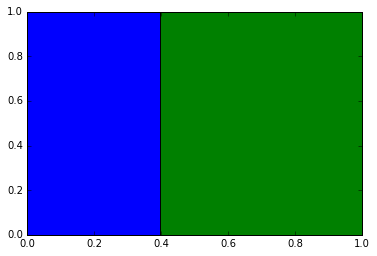
実験結果は以下のようになった.
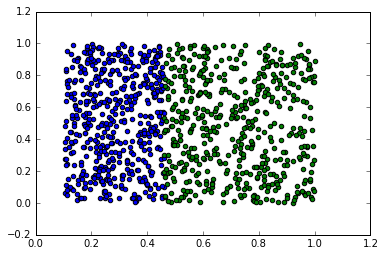
最初の図が与えられた長方形を適切に配置したもので,これを再現するように頑張る.次の図が配置結果.うまく配置できていることがわかる.
次回は,前の記事のテンプレート生成で,テンプレートを生成しまくって,与えられた画像リストとの高速マッチングを実装したいかなあなんて思っている.
import itertools
import matplotlib.pyplot as plt
import numpy as np
from scipy import stats, optimize

def generate_template(n, width, height, random_state=1, max_random_state=10000, offset=0):
    L = [np.array([offset, offset, width-offset, height-offset])]
    random_state_lists = stats.randint.rvs(0, max_random_state, size=(n-1, 4), random_state=random_state)

    for random_state_list in random_state_lists:
        n_areas = len(L)
        if n_areas == 1:
            i = 0
        else:
            p = np.repeat(1 / (n_areas + i), n_areas)
            x = stats.multinomial.rvs(1, p, size=1, random_state=random_state_list[0])[0]
            i = x.argmax()

        y = stats.bernoulli.rvs(0.5, size=1, random_state=random_state_list[1])[0]
        if y == 0:
            b = stats.uniform.rvs(L[i][0], L[i][2] - L[i][0], size=1, random_state=random_state_list[2])[0]
            #b = stats.uniform.rvs(L[i][0], L[i][2] - L[i][0], size=1, random_state=random_state_list[2])[0]
        else:
            b = stats.uniform.rvs(L[i][1], L[i][3] - L[i][1], size=1, random_state=random_state_list[3])[0]
            #b = stats.uniform.rvs(L[i][1], L[i][3] - L[i][1], size=1, random_state=random_state_list[3])[0]
        if y == 0:
            area1 = np.array([L[i][0], L[i][1], b-offset/2, L[i][3]])
            area2 = np.array([b+offset/2, L[i][1], L[i][2], L[i][3]])
        else:
            area1 = np.array([L[i][0], L[i][1], L[i][2], b-offset/2])
            area2 = np.array([L[i][0], b+offset/2, L[i][2], L[i][3]])
        L.pop(i)
        L.append(area1)
        L.append(area2)
    return L


def negative_log_likelihood(L, X, Z):
    n_components = X.shape[0]
    L = L.reshape((n_components, 2))
    mixture_rate = np.repeat(1/n_components, n_components)
    values = np.zeros((Z.shape[0], n_components))
    for i in range(n_components):
        q = stats.multivariate_normal(L[i]+X[i]/2, [[X[i][0]/2, 0], [0, X[i][1]/2]])
        values[:, i] = q.pdf(Z) * mixture_rate[i]
    tmp = values.sum(axis=1)
    return - np.log(tmp[tmp!=0]).sum()


def compute_intersected_area(p1, p2, x1, x2):
    left = np.max([p1[0], p2[0]])
    right = np.min([p1[0] + x1[0], p2[0] + x2[0]])
    bottom = np.max([p1[1] + x1[1], p2[1] + x2[1]])
    top = np.min([p1[1], p2[1]])
    return np.max([0, (right - left) * (bottom - top)])


def constraint(L, X):
    P = L.reshape(X.shape)
    intersected_area = 0.0
    for i, j in itertools.combinations(range(X.shape[0]), 2):
        #intersected_area += compute_intersected_area(P[i], P[j], X[i]*s[i], X[j]*s[j])
        intersected_area += compute_intersected_area(P[i], P[j], X[i], X[j])
    return intersected_area


def estimate(X, w, h, scale=2, random_state=1):
    r = np.random.RandomState(random_state)
    Ls = r.uniform(0, 1, size=(20, X.shape[0]*2))

    px = stats.uniform(0, 1)
    py = stats.uniform(0, 1)
    pxy = lambda xy: px.pdf(xy[:, 0]) * py.pdf(xy[:, 1])

    n_samples = 500

    Z = np.c_[px.rvs(n_samples, random_state=rs), py.rvs(n_samples, random_state=rs+1)]

    constraints = ({"type": "eq", "fun": constraint, "args": (X,)})
    #bounds = [tmp for i in range(X.shape[0]) for tmp in [(0, scale-X[i][0]), (0, scale-X[i][1])]]
    bounds = [tmp for i in range(X.shape[0]) for tmp in [(0, w*scale-X[i][0]), (0, h*scale-X[i][1])]]
    lowest_loss = np.inf
    best_result = None
    for L in Ls:
        result = optimize.minimize(
            negative_log_likelihood,
            L.ravel(),
            args=(X, Z),
            bounds=bounds,
            options={"disp": True, "maxiter": 500},
            constraints=constraints,
        )
        if result.status != 0:
            continue
        loss = negative_log_likelihood(result.x.reshape(X.shape), X, Z)
        if loss < lowest_loss:
            best_result = result
            lowest_loss = loss
    result = best_result
    return result.x.reshape(X.shape)


def plot_result(L_pred, X, n_samples=100, colors=["b", "g", "r", "c", "m", "y", "k"]):
    n = L_pred.shape[0]
    for i in range(n):
        Z_i = np.c_[stats.uniform.rvs(L_pred[i][0], X[i][0], size=n_samples),
                    stats.uniform.rvs(L_pred[i][1], X[i][1], size=n_samples)]
        print(Z_i.max())
        plt.scatter(Z_i[:, 0], Z_i[:, 1], c=colors[i])
    plt.show()

rs = 1
width, height = 1, 1

L = generate_template(2, width, height, random_state=3, offset=0)
L = np.array(L)
X = np.c_[L[:, 2] - L[:, 0], L[:, 3] - L[:, 1]]


L_pred = estimate(X, width, height, scale=2)

tmp = np.maximum((L_pred + X).max(axis=0), 1)
plot_result(L_pred / tmp, X / tmp, n_samples=500)