GeoHex とは
GeoHex は地図上を六角形の領域で区切った位置情報表現。
六角形のひとつひとつに場所を表すコードが付いている。
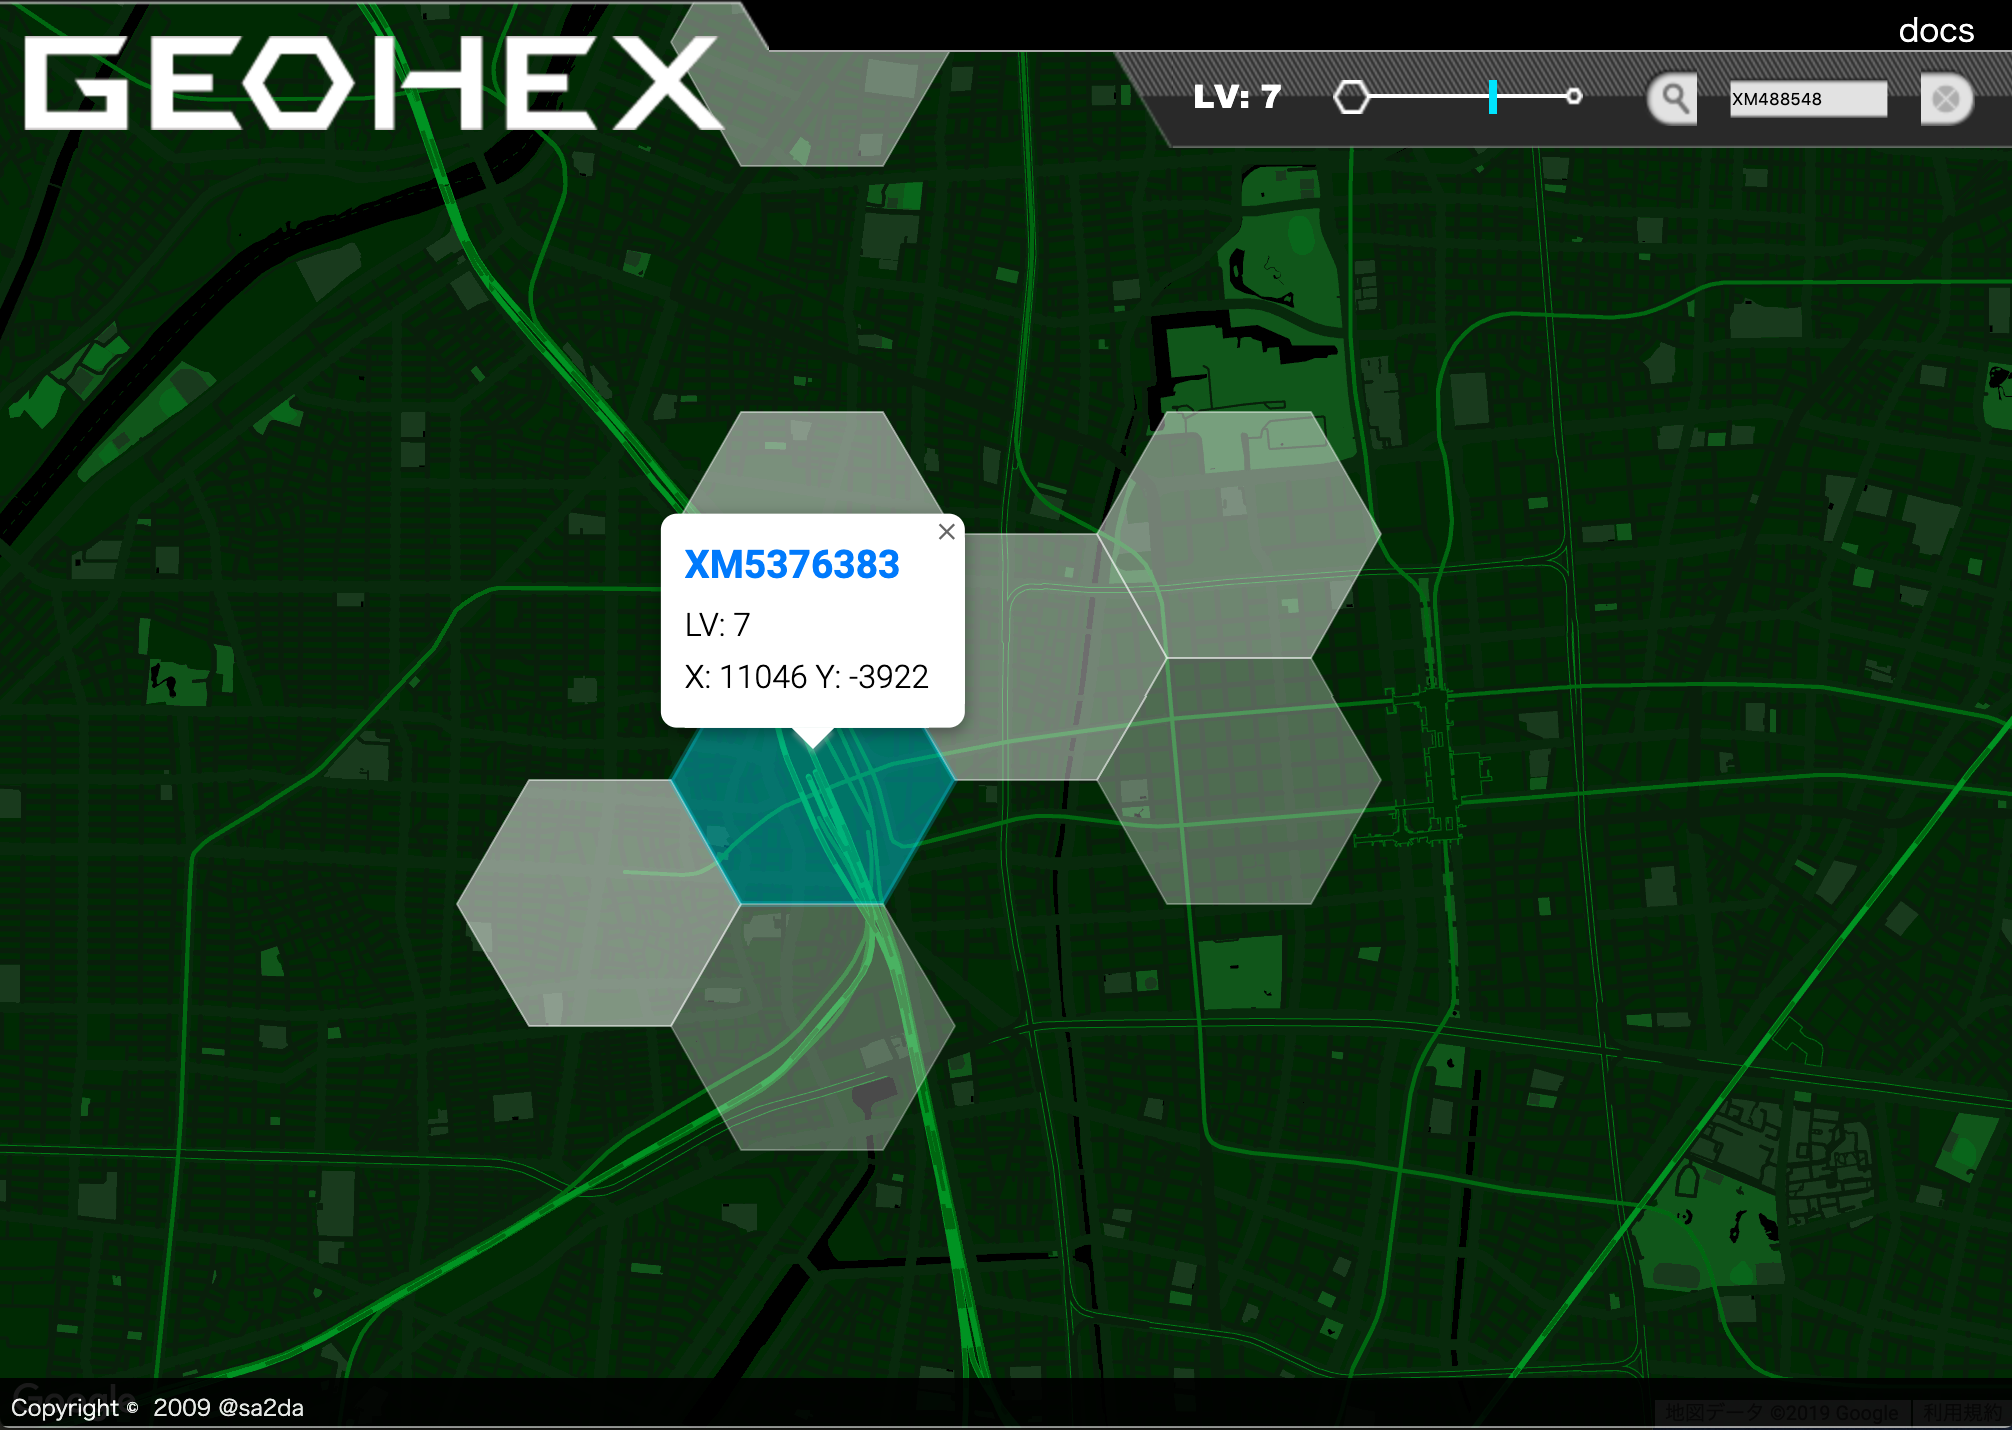
Hexagonal geo-coding system / Original mapping project
GeoHex/ GEOHEX devide whole target area into honeycomb geometry regions.
ドラゴンクエストウォークで使われているらしい
ドラゴンクエストウォークはスマートフォン向け位置情報ゲーム。
参考情報: ドラゴンクエストウォーク 公式プロモーションサイト | SQUARE ENIX
ドラゴンクエストウォークを起動して、各種情報の画面を見ると、 GeoHex のライセンスが表示されている。
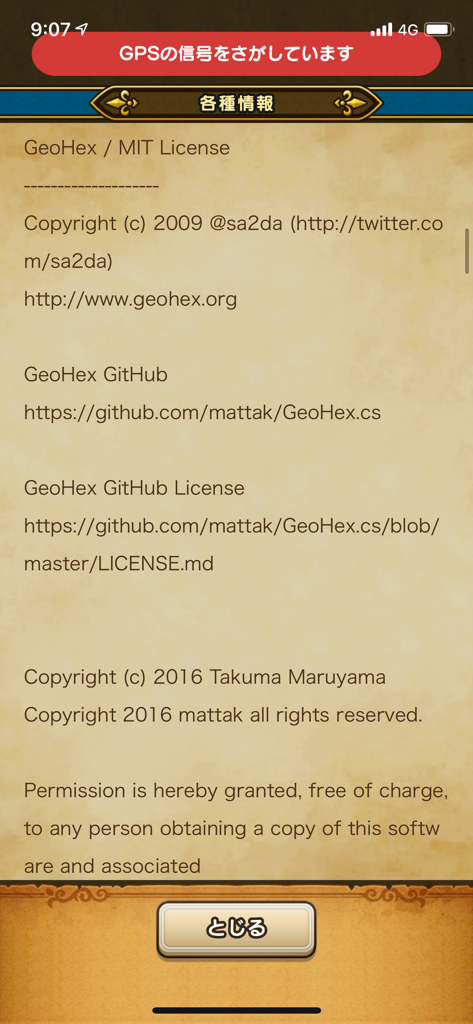
GeoHex をどのように使っているのかわからないが、もしかして距離を算出するのに使っているのだろうか?
GeoHex を YOLP 地図上に表示する
YOLP:Yahoo! JavaScriptマップAPI の上に GeoHex を表示するサンプルを作成した。
動作確認環境: macOS Mojave + Google Chrome 77.0.3865.90
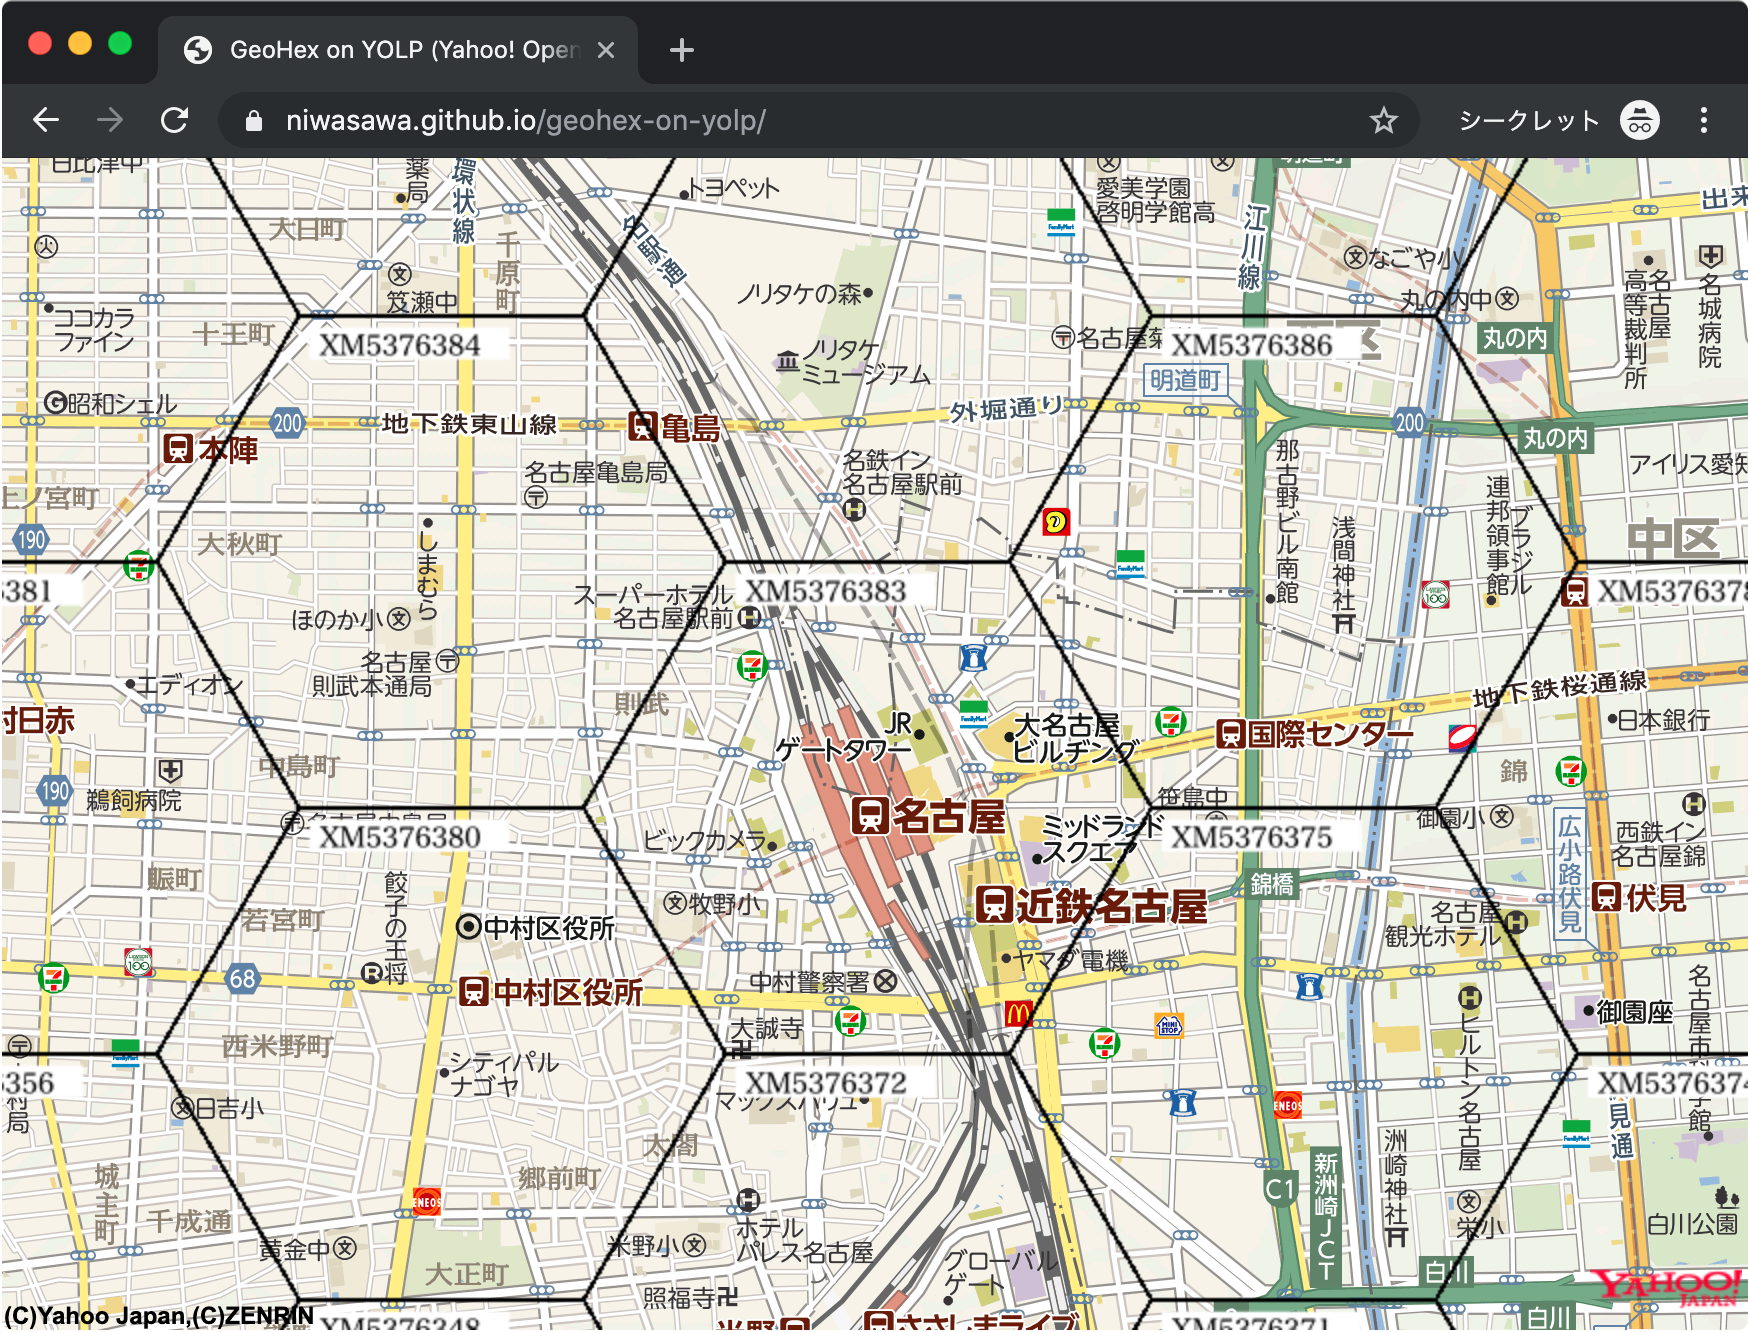
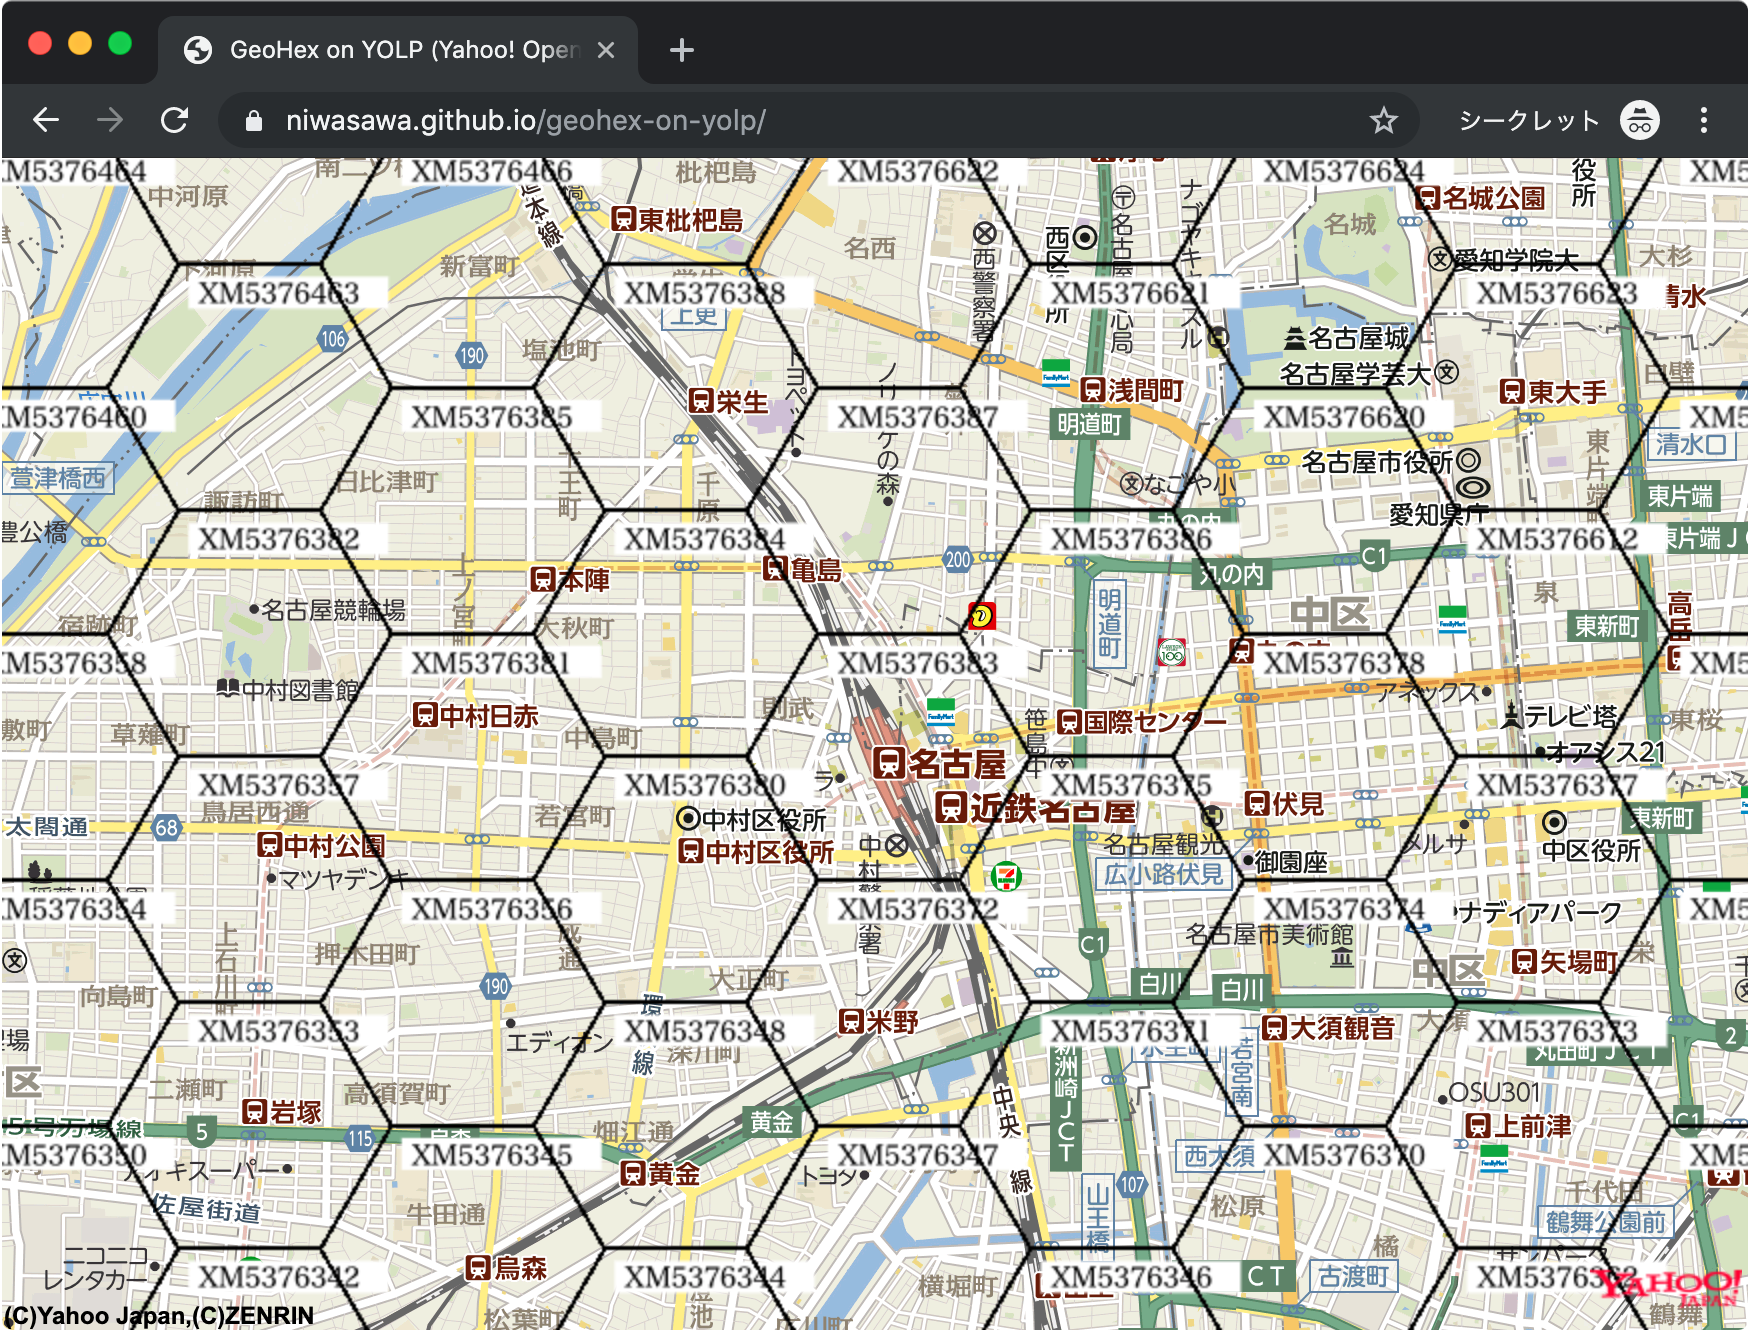
動作サンプルページ: GeoHex on YOLP (Yahoo! Open Local Platform JavaScript Map API)
ソースコード
地図上に GeoHex を表示するための GeoHexLayer クラスを作成し、Map オブジェクトにレイヤー追加することで GeoHex 表示を実現している。
GeoHexLayer クラス (geohexlayer.js)
// GeoHex を表示するレイヤーです
class GeoHexLayer extends Y.Layer {

  constructor() {
    super();
    this.initializedLayer = false; // このレイヤー独自の初期化が終わっているか
  }

  // レイヤーを描画します
  // Y.Layer.drawLayer をオーバーライドしています
  drawLayer(force) {

    // レイヤーの初期化
    if (!this.initializedLayer) {
      this.initializedLayer = true; // レイヤー初期化済みフラグをONに
      this.hexLevel = 7; // Hex の大きさを表すレベル
      this.canvas = null; // 描画用 Canvas
      this.drawnItems = new Array(); // 描画済み Hex のリスト
      this.getMap().bind("move", this.onMove, this); // 地図移動時のイベントを捕捉する
    }

    // GeoHex 描画処理
    this.createCanvas();
    this.drawGeoHexList();
  }

  // 地図移動時に実行します
  onMove() {
    this.drawLayer();
  }

  // Canvas 要素を生成します
  createCanvas () {

    // すでに Canvas 要素が存在していたらクリアする
    if (this.canvas) {
      this.canvas.remove();
      this.drawnItems = new Array();
    }

    // Canvas 要素を生成
    let canvas = document.createElement("canvas");
    canvas.style.position = "fixed";
    canvas.style.top = 0;
    canvas.style.left = 0;

    // 地図を表示している要素を取得
    const container = this.getMapContainer();
    if (container && container[0]) {
      // Canvas 要素のサイズを地図表示している要素に合わせる
      canvas.width = container[0].offsetWidth;
      canvas.height = container[0].offsetHeight;
      // Canvas 要素を追加
      container[0].appendChild(canvas);
    }

    this.canvas = canvas;
  }

  // GeoHex を描画します
  drawGeoHexList() {

    // 地図表示領域の矩形を緯度経度座標で取得
    const bounds = this.getMap().getBounds(); // LatLngBounds
    const sw = bounds.getSouthWest();
    const ne = bounds.getNorthEast();

    // getXYListByRect.js を使用して
    // 矩形領域内の Hex リストを取得 ([{"x":x, "y":y}] 形式)
    const hexBuffer = true;
    const xyList = getXYListByRect(sw.lat(), sw.lng(), ne.lat(), ne.lng(), this.hexLevel, hexBuffer);

    // Hex をひとつずつ描画
    for(let xy of xyList) {
      // hex_v3.2_core.js を使用して Zone オブジェクトを取得
      const zone = GEOHEX.getZoneByXY(xy.x, xy.y, this.hexLevel);
      // Hex を描画
      this.drawGeoHex(zone);
    }
  }

  // Hex を描画します
  // zone: Hex 領域1つを表すオブジェクト
  drawGeoHex (zone) {

    // 描画済みなら何もしない
    if (this.drawnItems.includes(zone)) {
      return;
    }

    // 六角形の緯度経度をピクセル座標に変換
    const pixels = this.coordsToPixels(zone.getHexCoords());

    // Canvas に描画
    const ctx = this.canvas.getContext("2d");
    ctx.strokeStyle = "black";

    // 六角形を描画
    this.storokeHexagon(ctx, pixels);

    // Code を描画 (本来なら配置位置や文字の大きさを動的に調整すべき)
    ctx.fillStyle = "white"; // 背景色
    ctx.fillRect(pixels[1].x + 5, pixels[1].y + 6, 100, 16);
    ctx.fillStyle = "black"; // 文字色
    ctx.font = "14px serif";
    ctx.fillText(zone.code, pixels[1].x + 10, pixels[1].y + 20);

    // 描画済みリストに追加
    this.drawnItems.push(zone);
  }

  // GeoHex 形式の緯度経度の配列をコンテナ座標へ変換します
  // coords: GeoHex 形式の緯度経度オブジェクトの配列
  coordsToPixels(coords) {
    let pixels = new Array();
    for(let c of coords) {
      pixels.push(this.fromLatLngToContainerPixel(new Y.LatLng(c.lat, c.lon)));
    }
    return pixels;
  }

  // 六角形を描画します
  // ctx: CanvasRenderingContext2D オブジェクト
  // pixels: コンテナ座標の配列
  storokeHexagon(ctx, pixels) {
    ctx.moveTo(pixels[5].x, pixels[5].y);
    for(let p of pixels) {
      ctx.lineTo(p.x, p.y);
    }
    ctx.stroke();
  }
};
HTML
<!DOCTYPE html>
<html>
<head>
<title>GeoHex on YOLP (Yahoo! Open Local Platform JavaScript Map API)</title>
<meta charset="UTF-8">
<style>
html, body {
  margin: 0;
  padding: 0;
  width: 100%;
  height: 100%;
}
# map {
  width: 100%;
  height: 100%;
}
</style>
</head>
<body>

<div id="map"></div>

<!-- YOLP Yahoo! JavaScriptマップAPI -->
<script type="text/javascript" charset="utf-8" src="https://map.yahooapis.jp/js/V1/jsapi?appid=YOUR_APPLICATION_ID"></script>

<!-- GeoHex ライブラリ -->
<script src="http://geohex.net/src/script/hex_v3.2_core.js"></script>
<script src="http://geohex.net/src/script/getXYListByRect.js"></script>

<!-- 今回作成した GeoHexLayer -->
<script src="geohexlayer.js"></script>

<script>

// Map オブジェクトを生成
var ymap = new Y.Map("map", {
  "configure": {
    "dragging": true,
    "singleClickPan": false,
    "doubleClickZoom": true,
    "continuousZoom": true,
    "scrollWheelZoom": true
  }
});

// GeoHexLayer を追加
ymap.addLayer(new GeoHexLayer('map'));

// 名古屋駅付近の地図を表示
var p = {lat : 35.171962, lon : 136.8817322, zoom : 16};
ymap.drawMap(new Y.LatLng(p.lat, p.lon), p.zoom, Y.LayerSetId.NORMAL);

// リサイズ時に地図を再描画
window.addEventListener("resize", () => {
  ymap.updateSize();
});

</script>
</body>
</html>