概要
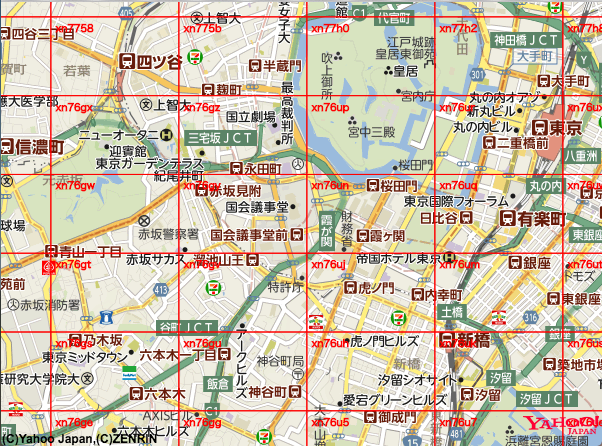
ヤフーのYOLPで提供されている、地図上にジオハッシュの矩形を表示する画面をつくりました。
-
https://ctyo.github.io/MapOnRect/geohash?geohash_length=5&z=14
- geohash_lenghはジオハッシュ桁数(桁数が大きいほど詳細)
- zは地図のズームレベルを指定
- ソースコード全体 : https://github.com/ctyo/MapOnRect
※ Chromeでのみ動作確認
ジオハッシュについて
ジオハッシュ - Wikipedia をご参照ください。
ジオハッシュ計算のプログラムは書かず、chrisveness/latlon-geohash こちらのライブラリを利用しました。
実装
独自のレイヤーを追加
ジオハッシュを描画しているレイヤーは Y.Layerクラスを継承して作成できます。
class CanvasLayer extends Y.Layer {
こちらを地図オブジェクトに追加すればhtml上に追加された状態になります。
var canvasLayer = new CanvasLayer(..省略..);
ymap.addLayer(canvasLayer);
ジオハッシュの矩形を描画
レイヤー上ではCanvasオブジェクトを画面全体に配置し、緯度経度に対応したジオハッシュの矩形を描画するようにしました。
        var strokeGeohash = function (geohash) {
            var bounds = Geohash.bounds(geohash); // ジオハッシュ文字列から矩形緯度経度を取得
            var ne = that.fromLatLngToContainerPixel(new Y.LatLng(bounds.ne.lat, bounds.ne.lon)); // 北東の緯度経度をDOM上のpx値に変換
            var sw = that.fromLatLngToContainerPixel(new Y.LatLng(bounds.sw.lat, bounds.sw.lon)); // 南西の緯度経度をDOM上のpx値に変換
            // canvas に描画する
            var ctx = self.canvas_.getContext('2d');
            ctx.strokeStyle = "red";
            ctx.strokeRect(sw.x, ne.y, ne.x - sw.x, sw.y - ne.y); // canvasのstrokeRectは top, left, width, heightの並び
            ctx.strokeText(geohash, sw.x + 5, ne.y + 15); // 文字は矩形の中に収まるように微調整
        }
画面全体への描画
画面全体に描画には再帰処理で対応しました。
描画の終了の判定は、画面外にジオハッシュの矩形の端がすべて出たらというものにしました。
ヤフー地図のJSAPIには便利なことに指定の矩形内に緯度経度が収まっているかを判定する関数が用意されていましたので以下のように書けました。
            // 描画エリア内か確認
            var bounds = Geohash.bounds(geohash);
            var ymap = that.getMap(); // 地図全体を取得
            var map_bounds = ymap.getBounds(); // 表示している地図の矩形を取得
            if (!(
                map_bounds.containsLatLng(new Y.LatLng(bounds.ne.lat, bounds.ne.lon)) || // 北東
                map_bounds.containsLatLng(new Y.LatLng(bounds.sw.lat, bounds.ne.lon)) || // 北西
                map_bounds.containsLatLng(new Y.LatLng(bounds.sw.lat, bounds.sw.lon)) || // 南西
                map_bounds.containsLatLng(new Y.LatLng(bounds.ne.lat, bounds.sw.lon))    // 南東
            )) {
                return; // すべての判定が地図全体より外だったらreturnする。
            }
