NBAのデータ分析
初っ端から余談です。
個人的にNBA(Warriors)の特にKlayThompsonという選手が好きでよく試合やハイライトを見ているのですが、1ファンとして見ているだけでした。
しかし、Youtubeのとある動画を見つけてデータスポーツに興味を持ち、ちょっと勉強がてらやってみようかなと思いました。とある動画
自チーム・相手チームのドライブ数やCのDFG%を調べ上げ、期待値の基準に満たない選手の3Pはキッパリ捨てる。相手チームながらすごいなぁと思うばかりでした・・・
必要なもの
nba_api
NBAは一般向けにStatsAPIを公開しているのですが、それをPythonで使いやすくまとめてくれているものです。nba_api
バスケットコートの描画
今回シュートチャートを作るにあたりバスケットコートを描画する必要があったのですが、海外の方のコードを引用したいと思います。
from matplotlib.patches import Circle, Rectangle, Arc

def draw_court(ax=None, color='black', lw=2, outer_lines=False):
    # If an axes object isn't provided to plot onto, just get current one
    if ax is None:
        ax = plt.gca()

    # Create the various parts of an NBA basketball court

    # Create the basketball hoop
    # Diameter of a hoop is 18" so it has a radius of 9", which is a value
    # 7.5 in our coordinate system
    hoop = Circle((0, 0), radius=7.5, linewidth=lw, color=color, fill=False)

    # Create backboard → rectangle(xy,width,height,linewidth,color)
    # xyは始点の指定,width・heightは始点からの横・縦
    backboard = Rectangle((-30, -7.5), 60, -1, linewidth=lw, color=color)

    # The paint
    # Create the outer box 0f the paint, width=16ft, height=19ft
    outer_box = Rectangle((-80, -47.5), 160, 190, linewidth=lw, color=color,
                          fill=False)
    # Create the inner box of the paint, widt=12ft, height=19ft
    inner_box = Rectangle((-60, -47.5), 120, 190, linewidth=lw, color=color,
                          fill=False)

    # Create free throw top arc
    top_free_throw = Arc((0, 142.5), 120, 120, theta1=0, theta2=180,
                         linewidth=lw, color=color, fill=False)
    # Create free throw bottom arc
    bottom_free_throw = Arc((0, 142.5), 120, 120, theta1=180, theta2=0,
                            linewidth=lw, color=color, linestyle='dashed')
    # Restricted Zone, it is an arc with 4ft radius from center of the hoop
    restricted = Arc((0, 0), 80, 80, theta1=0, theta2=180, linewidth=lw,
                     color=color)

    # Three point line
    # Create the side 3pt lines, they are 14ft long before they begin to arc
    corner_three_a = Rectangle((-220, -47.5), 0, 140, linewidth=lw,
                               color=color)
    corner_three_b = Rectangle((220, -47.5), 0, 140, linewidth=lw, color=color)
    # 3pt arc - center of arc will be the hoop, arc is 23'9" away from hoop
    # I just played around with the theta values until they lined up with the
    # threes
    three_arc = Arc((0, 0), 475, 475, theta1=22, theta2=158, linewidth=lw,
                    color=color)

    # Center Court
    center_outer_arc = Arc((0, 422.5), 120, 120, theta1=180, theta2=0,
                           linewidth=lw, color=color)
    center_inner_arc = Arc((0, 422.5), 40, 40, theta1=180, theta2=0,
                           linewidth=lw, color=color)

    # List of the court elements to be plotted onto the axes
    court_elements = [hoop, backboard, outer_box, inner_box, top_free_throw,
                      bottom_free_throw, restricted, corner_three_a,
                      corner_three_b, three_arc, center_outer_arc,
                      center_inner_arc]

    if outer_lines:
        # Draw the half court line, baseline and side out bound lines
        outer_lines = Rectangle((-250, -47.5), 500, 470, linewidth=lw,
                                color=color, fill=False)
        court_elements.append(outer_lines)

    # Add the court elements onto the axes
    for element in court_elements:
        ax.add_patch(element)

    return ax
シュートチャート
では、早速作っていきたいと思います。
シュートチャートを作る上で、nba_apiのshotchartdetailという関数を使います。
これは主にteam_id,player_id,game_idなどを渡すことで選手がどの位置からどのようなシュートを打ったかが全てわかります。最新のゲームデータまで載っているので大変便利です。
nba_apiからは全てjson形式で受け取るので、今回はそれをDataframeにまとめて、そこからプロットしていきます。
また、今回は指定した選手またはチームの各エリアからのシュート成功率とエリア別のシュート割合をまとめてみようと思います。
%matplotlib inline
import matplotlib.pyplot as plt
import pandas as pd
import json
from nba_api.stats.endpoints import shotchartdetail,leaguedashptdefend,leaguedashptteamdefend,teamdashptshots,playerdashptshots
import numpy as np
from IPython.display import display

shot_zone_basic = ["Above the Break 3","Right Corner 3","Left Corner 3","Mid-Range","In The Paint (Non-RA)","Restricted Area"]
shot_zone_area = ["Center(C)","Right Side Center(RC)","Left Side Center(LC)","Left Side(L)","Right Side(R)"]

def get_shotchart(team_id=0,opponent_id=0,player_id=0,Season="",game_id="",n_games=0):
    player_shots = shotchartdetail.ShotChartDetail(team_id=team_id,player_id=player_id,opponent_team_id=opponent_id,season_nullable=Season,game_id_nullable=game_id,context_measure_simple="FGA",last_n_games=n_games)
    player_shots = json.loads(player_shots.get_json())
    shots = player_shots["resultSets"][0]["rowSet"]
    headers = player_shots["resultSets"][0]["headers"]
    shot_df = pd.DataFrame(shots, columns=headers)
    all_shots_num = len(shot_df)
    shot_position = pd.DataFrame(columns=["Accuracy","FGM/FGA in this Area","Shot_Type_Ratio","FGA in this Area/All Shots"])
    for basic in shot_zone_basic:
        for area in shot_zone_area:
            #各ゾーンでのシュートを絞る
            shots_each_area = shot_df[(shot_df.SHOT_ZONE_AREA == area) & (shot_df.SHOT_ZONE_BASIC == basic)]
            #その中で決まったものだけを絞る
            made_shots = shots_each_area[shots_each_area.SHOT_MADE_FLAG==1]
            #決まった本数
            made_shots_num = len(made_shots)
            #ゾーンの本数
            shots_num = len(shots_each_area)
            if shots_num == 0:
                continue
            shot_position.loc[basic+" and "+area] = [str(round(made_shots_num/shots_num*100,3))+"%",str(made_shots_num)+"/"+str(shots_num),str(round(shots_num/all_shots_num*100,3))+"%",str(shots_num)+"/"+str(all_shots_num)]

    #2P,3PのAccuracyを算出
    df_2pfg = shot_df[shot_df.SHOT_TYPE == "2PT Field Goal"]
    df_2pfg_made = df_2pfg[df_2pfg.SHOT_MADE_FLAG == 1]
    df_3pfg = shot_df[shot_df.SHOT_TYPE == "3PT Field Goal"]
    df_3pfg_made = df_3pfg[df_3pfg.SHOT_MADE_FLAG == 1]
    print("2PFG%" + "     " + str(round(len(df_2pfg_made)/len(df_2pfg)*100,3)) + "%")
    print("3PFG%" + "     " + str(round(len(df_3pfg_made)/len(df_3pfg)*100,3)) + "%")

    #可視化
    made = shot_df[shot_df.SHOT_MADE_FLAG == 1]
    miss = shot_df[shot_df.SHOT_MADE_FLAG == 0]
    plt.figure(figsize=(12,11))
    plt.scatter(made.LOC_X, made.LOC_Y,c="green")
    plt.scatter(miss.LOC_X, miss.LOC_Y,c="red")
    draw_court(outer_lines=True)
    plt.xlim(-250,250)
    plt.ylim(422.5, -47.5)
    #コートの向き
#     plt.xlim(-300,300)
#     plt.ylim(-100,500)
    plt.show()
    display(shot_position)
この関数でKlayThompsonの2018-19期のシュートチャートを出してみると
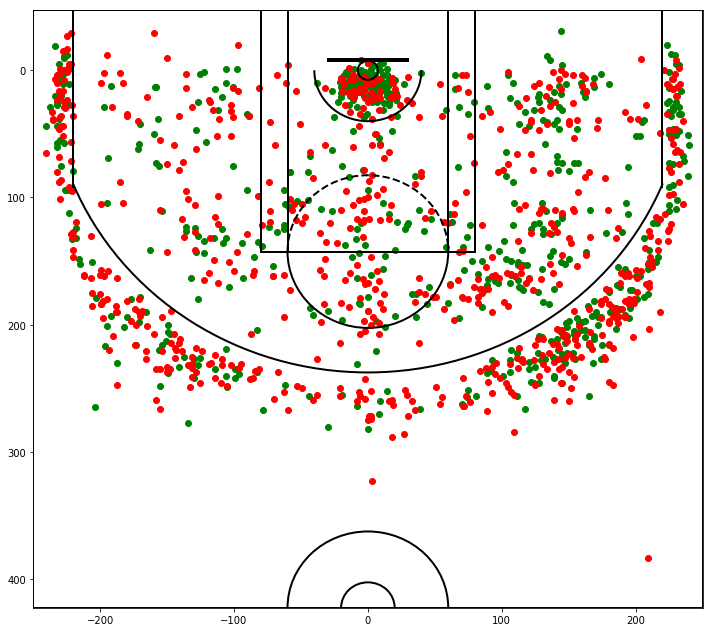
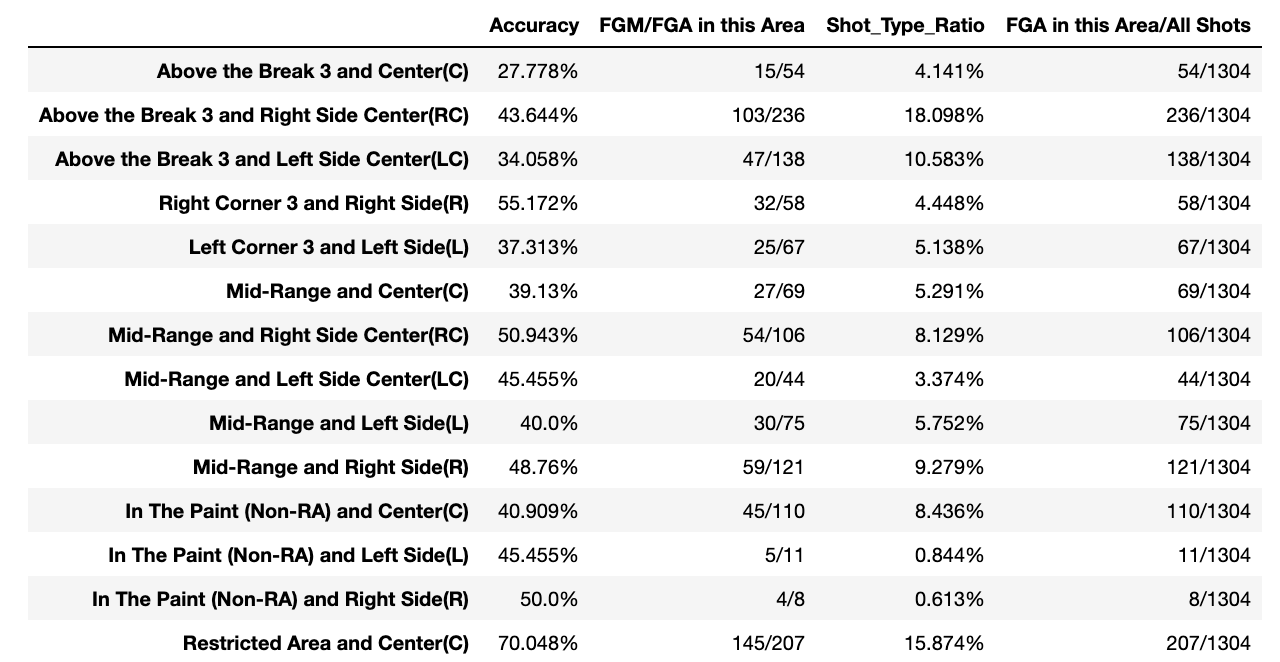
正常に表示されました。
その他
他にもdefence_chart(リングからの距離別防御率?みたいなもの)なども作ってみました。
def defence_chart(team_id=0,opponent_team_id=0,player_id=0,Season="",n_games=0):
    defence_category=["Overall","2 Pointers","3 Pointers","Less Than 6Ft","Less Than 10Ft","Greater Than 15Ft"]
    if player_id == 0:
        headers = ["TEAM_ID","TEAM_NAME","TEAM_ABBREVIATION","GP","G","FREQ","FGM","FGA","FG%","NS%","PLUSMINUS"]
        team_def = pd.DataFrame(columns=headers)
        for category in defence_category:
            team = leaguedashptteamdefend.LeagueDashPtTeamDefend(team_id_nullable=team_id,opponent_team_id_nullable=opponent_team_id,season=Season,last_n_games_nullable=n_games,defense_category=category)
            team = json.loads(team.get_json())
            contents = team["resultSets"][0]["rowSet"]
            team_def.loc[category] = contents[0]
        display(team_def[["TEAM_ABBREVIATION","FREQ","FGM","FGA","FG%"]])
    else:
        headers = ["CLOSE_DEF_PERSON_ID","PLAYER_NAME","PLAYER_LAST_TEAM_ID","PLAYER_LAST_TEAM_ABBREVIATION","PLAYER_POSITION","AGE","GP","G","FREQ","D_FGM","D_FGA","D_FG_PCT","NORMAL_FG_PCT","PCT_PLUSMINUS"]
        player_def = pd.DataFrame(columns=headers)
        for category in defence_category:
            player = leaguedashptdefend.LeagueDashPtDefend(team_id_nullable=team_id,player_id_nullable=player_id,season=Season,defense_category=category)
            player = json.loads(player.get_json())
            contents = player["resultSets"][0]["rowSet"]
            player_def.loc[category] = contents[0]
        display(player_def[["FREQ","D_FGM","D_FGA","D_FG_PCT","NORMAL_FG_PCT"]])

def shot_dashboard(team_id=0,player_id=0,Season="",n_games=0):
    if player_id == 0:
        data = teamdashptshots.TeamDashPtShots(team_id=team_id,season=Season)
        data = json.loads(data.get_json())
        counter = 6
    else:
        data = playerdashptshots.PlayerDashPtShots(team_id=team_id,player_id=player_id,season=Season)
        data = json.loads(data.get_json())
        counter = 7

    for i in range(counter):
        contents = data["resultSets"][i]["rowSet"]
        headers = data["resultSets"][i]["headers"]
        df = pd.DataFrame(contents, columns=headers)
        display(df)
終わりに
他にも色々作っていきたいですが、もちろんこれからどう分析するかが一番大事なので機械学習などを勉強してバスケットボールというかKlayThompsonに活かせればなぁと思います。
ついでに言うと、選手とボールのトラッキングデータとかB Leagueが公開してくれないかなと日々願っております。