背景
複数のデータを重ね書きしたプロットの中で、点の座標やどのデータに帰属しているのかということを読み取るために、Annotate をインタラクティブに使ってピックした要素の情報を表示させます。外部のプログラムから取り込んだデータをプロットして内容をチェックするような状況で役に立ちます。
コンソールに数値を print する例は matplotlib 公式サイト [1] や Qiita の記事 [2]にもありますが、 annotation を書き換えるところまで作ったもので、コードの例を示して説明します
動作確認環境
windows10, python 3.7.3, anaconda で環境導入。
主に IDE 下 (spyder) で確認。
前提
matplotlib でインタラクティブに操作できるプロットが表示されるようになっている必要があります。
例えば、次のようにしたときに、こんな操作ボタン付きのプロットウインドウが出る設定になっているところからスタートします。
コマンドライン :
python -i (スクリプト名).py
Spyder :
- [設定] - [IPythonコンソール] ― [グラフィックス (タブ)] から
グラフィックスのバックエンドを 自動 にします。
matplotlib の 一連のコマンドを評価したときに、別ウインドウででプロットが表示されるはず。
JupyterLab :
-
%matplotlib widgetを使えるようにしてから
jupyter-matplotlibを使う を参照して設定。
チュートリアルを参考に作ったシンプルなコード
#%%
import matplotlib.pyplot as plt
import numpy as np

fig, ax = plt.subplots(1, 1, figsize=(6, 4))
line0 = ax.plot(np.random.rand(10), picker=5)
line1 = ax.plot(np.random.rand(10), picker=5)
lines = line0 + line1 # list of lines
annotation = ax.annotate('', (0.5,0.5), xytext=(15, 15),
            textcoords="offset points", arrowprops={'arrowstyle': "->"},
            bbox=dict(boxstyle="round", fc="w") )
annotation.get_bbox_patch().set_alpha(0.4)
annotation.set_visible(False)

def onpick(event):
    line = event.artist
    if line in lines:
        ind = event.ind
        points = line.get_xydata()
        annotation.xy = points[ind[0]]
        annotation.set_text("line{}, point#{} at ({:4.1f}, {:4.1f})".format(
            lines.index(line), ind[0],
            points[ind[0]][0], points[ind[0]][1]))
        annotation.set_visible(True)
        fig.canvas.draw_idle()

_, = fig.canvas.mpl_connect('pick_event', onpick)
このコードで、artist に紐づけた情報をたどって、annotation の表示テキストをアップデートしてやる、という基本の構造がわかります。説明用の簡単なモデルなので、関数内外でグローバル変数を使ってしまっているのが、少し気になるところです。
クラスを作って使う例
このイベントハンドリングの仕組みを使って、もともとわかっているプロットラインごとの固有の名前を表示できるようにしたかったので、小さなクラスを作ってみました。
Pick Event Demo [1] のように、プロット作業全体をひとつの関数にして、変数と onpick() 関数のスコープを局所化するのが、グローバル変数を使わない一つの対応策です。ここでは、個別のプロット関数の呼び出しをフレキシブルに行えるようにしたかったので、クラスを使うことにしました。
コマンドラインから python -i で実行するとき、
Annotate_plot オブジェクトを手放してしまうと、Annotate が機能しなくなるので、
exec() 関数が、Annotate_plot オブジェクトを return するようにします。
import matplotlib.pyplot as plt
import numpy as np
class Annotate_plot(object):
def __init__(self, picker=5):
self.ldct = {}
self.picker = picker
def set_annotate(self, fig, ax):
self.annotate = ax.annotate("init", xy=(0, 0), xytext=(15, 15),
textcoords="offset points", arrowprops={'arrowstyle': "->"},
bbox=dict(boxstyle="round", fc="0.9", fontsize=11, zorder=4.) )
self.annotate.get_bbox_patch().set_alpha(0.6)
self.annotate.set_visible(False)
self.fig = fig
self.ax = ax
def plot(self, *args, label=None, **kw):
t, = ax.plot(*args, picker=self.picker, label=label, **kw)
if label:
self.ldct.update({t: label})
def onpick(self, event):
thisline = event.artist
ind = event.ind
points = thisline.get_xydata()
self.annotate.xy = points[ind[0]]
self.annotate.set_text(
"{}, point#{} at ({:4.1f}, {:4.1f})".format(
self.ldct[thisline], ind[0],
points[ind[0]][0], points[ind[0]][1]))
self.annotate.set_visible(True)
self.fig.canvas.draw_idle()
return True
def exec():
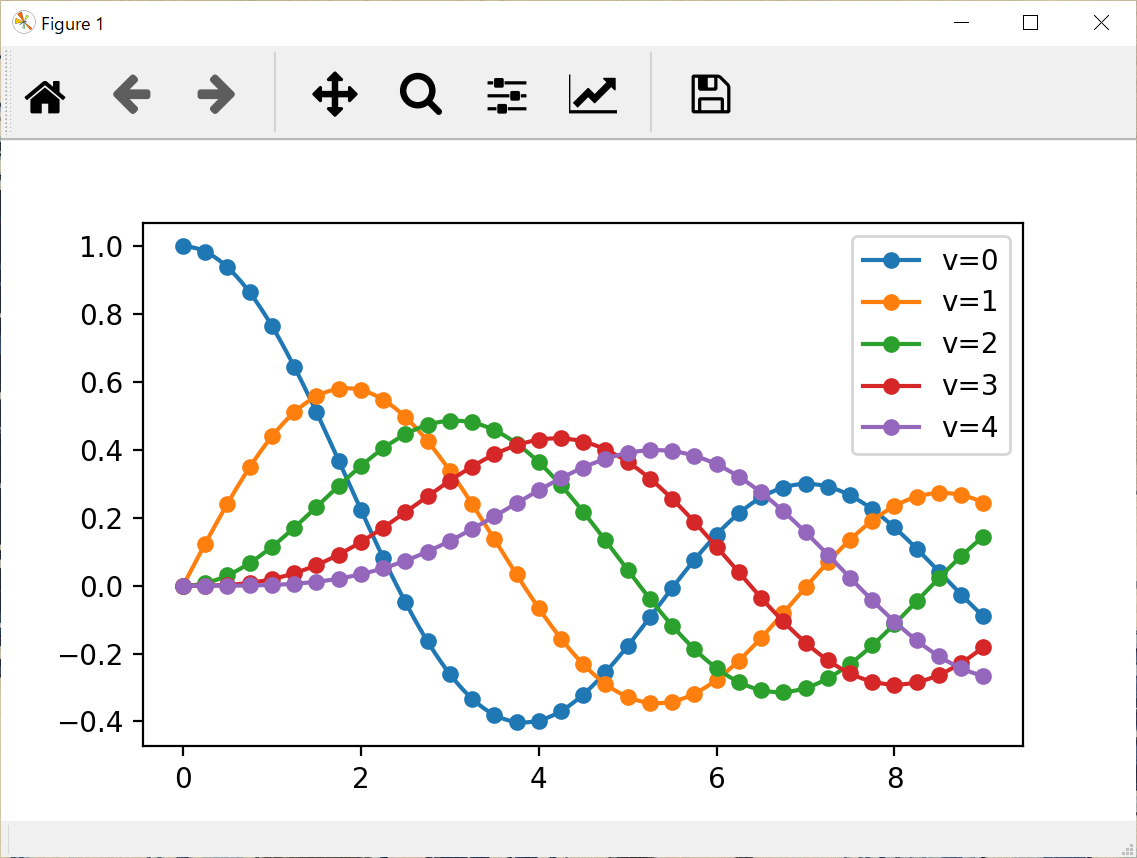
from scipy.special import jv # 見栄えの良い絵にするために、ベッセル関数を import してみました。
x = np.linspace(0., 5.)
fig, ax = plt.subplots(1, 1, figsize=(8, 6))
an = Annotate_plot()
an.set_annotate(fig, ax)
an.fig.canvas.mpl_connect('pick_event', an.onpick)
city = ['Tokyo', 'Sapporo', 'Nagoya', 'Kyoto', 'Osaka']
for i in range(5):
an.plot(x, jv(i, x), label=city[i])
ax.legend()
fig.show()
return an
if __name__ == "__main__":
an = exec()

class 固有の dict に、それぞれのプロットをキーとして、後で表示させたいテキストを値として与えておくことで、Annotate_plot.onpick() 関数がこれを読み出して annotate のテキストを更新しています。(貼り付けたスクリーンショットはインタラクティブではありませんが、実際はインタラクティブに表示を書き換えます。)
設定関係のコードはクラス内に入っているので、呼び出し側では、plt.subplots の後に 3行分のコードを加えるだけで済みます。そのあとは、plot の呼び出しを an.plot に書き換えて、表示させたい情報を label=city[i] という形で渡します。例では label を使って legend も表示しましたが、他のキーワードで受け渡しするように修正することも容易です。
ポリゴン図形などへの発展
Pick Event Demo [1] の onpick1() 関数を見ると、plot() で生成した Line2D 以外の Artist に対応させるには、Artist の種類ごとの場合分けが必要なことがわかります。
ここでは、matplotlib の polygon と Shapely [3] で作った PolygonPatch (descartes [4] というパッケージを介して渡される) に対応できるようにしてみました。図形が重なっている箇所では、最後に描画した図形がピックされます。zorder の調整で表示上の順序は変わりますが、pick される図形が入れ替わるわけではありませんでした。
ちなみに、Descartes の PolygonPatch は Shapley パッケージで生成したトーラス形状も含む polygon 形状を matplotlib にプロットさせるための小さなパッケージです。
#%%
import matplotlib.pyplot as plt
import numpy as np

from matplotlib.lines import Line2D

from shapely.geometry import LineString
from matplotlib.patches import Polygon, Patch
from descartes import PolygonPatch

class Annotate_plot(object):
    def __init__(self, picker=5):
        self.ldct = {}
        self.picker = picker

    def set_annotate(self, fig, ax):
        self.annotate = ax.annotate("init", xy=(0, 0), xytext=(15, 15),
            textcoords="offset points", arrowprops={'arrowstyle': "->"},
            bbox=dict(boxstyle="round", fc="w") )
        self.annotate.get_bbox_patch().set_alpha(0.4)
        self.annotate.set_visible(False)
        self.fig = fig

    def plot(self, *args, label=None, **kw):
        t, = ax.plot(*args, picker=self.picker, label=label, **kw)
        if label:
            self.ldct.update({t: label})

    def geo_polygon(self, *args, label=None, **kw):
        t = ax.add_patch(PolygonPatch(*args, **kw))
        t.set_picker(5)
        if label:
            self.ldct.update({t: label})
            ax.patches[-1].set_label(label)

    def polygon(self, *args, label=None, **kw):
        t = ax.add_patch(Polygon(*args, **kw))
        t.set_picker(5)
        if label:
            self.ldct.update({t: label})
            ax.patches[-1].set_label(label)

    def onpick(self, event):
        if isinstance(event.artist, Line2D):
            thisline = event.artist
            ind = event.ind
            points = thisline.get_xydata()
            self.annotate.xy = points[ind[0]]
            self.annotate.set_text(
                "{}, line#{} at ({:4.1f}, {:4.1f})".format(
                    self.ldct[thisline], ind[0],
                    points[ind[0]][0], points[ind[0]][1]))
        if isinstance(event.artist, Patch):
            thispatch = event.artist
            self.annotate.xy = (event.mouseevent.xdata,
                event.mouseevent.ydata)
            self.annotate.set_text(
                "{},  at ({:4.1f}, {:4.1f})".format(self.ldct[thispatch],
                    event.mouseevent.xdata, event.mouseevent.ydata))
        self.annotate.set_visible(True)
        self.fig.canvas.draw_idle()
        return True


pline = LineString([(0, 0), (1, 1), (0, 2), (2, 2), (3, 1), (1, 0)])
dilated = pline.buffer(0.5) # shapely の多角形
points = np.array(pline.xy).T + [0., 2.] # ラインの頂点だけを抽出

style = {'fc': 'blue', 'ec': 'blue', 'alpha': 0.5, 'zorder': 2}
style2 = {'fc': 'orange', 'ec': 'orange', 'alpha': 0.8,}

fig, ax = plt.subplots(1, 1, figsize=(8, 6), subplot_kw={'aspect':1})
an = Annotate_plot()
an.set_annotate(fig, ax)
_ = fig.canvas.mpl_connect('pick_event', an.onpick)

an.polygon(points, label="polygon", **style2)
an.geo_polygon(dilated, label="shapley", **style)
ax.legend()

ax.set_xlim(-1, 4)
ax.set_ylim(-1, 5)

fig.show()
参考にした情報
[1] Pick Event Demo | matplotlib.org
onpick のいろいろなバリエーションを例示。pick_scatter_plot() などの関数を少しずつ書き換えて試すことで、onpick で取得できる event の中身を確認していける。
[2] python/matplotlibの図上にてクリックで座標値を取得したりキーボード入力値を取得したりする | Qiita
[3] Shapely
[4] descartes
2024年3月8日更新
if __name__ == "__main__": 形式で呼び出す場合、 exec() 関数が、Annotate_plot オブジェクトを return するようにする必要があることを追記