やりたいこと
簡単にカッコいいグラフやチャートを表示できるJavascriptライブラリ「Chart.js」を使う際、色を自分で指定するのが大変。更にデータの個数が可変な時、自動的にいい感じの色を割り当てたい。
実現方法
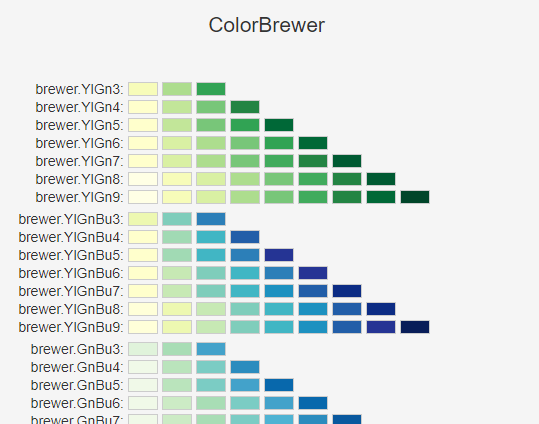
Chart.jsのプラグイン「chartjs-plugin-colorschemes」を使うとプリセットされたいい感じのカラースキームを使うことができます。
chartjs-plugin-colorschemes
https://nagix.github.io/chartjs-plugin-colorschemes/ja/
およそ500種類くらいのカラースキームが用意してあるので好みのものを選んでください。

今回はReactを使った例で説明していきます。更に「Chart.js」をそのまま使うのではなくのReactラッパーである「react-chartjs-2」を使っていきます。データをpropsで渡すだけでコンポーネントのように簡単にグラフやチャートを追加できます。
手順
まずはnpmを使ってインストールしていきます。
$ npm install --save chart.js react-chartjs-2 chartjs-plugin-colorschemes
追加したいjsファイルの先頭でモジュールのインポートをしていきましょう
//今回はドーナッツグラフを作ります
import { Doughnut } from 'react-chartjs-2';

//一括でインポートしても...
import 'chartjs-plugin-colorschemes';
//ファイルサイズを減らしたい場合はカラースキームだけをインポートしても大丈夫です
//今回はbrewr.Paired12というカラースキームを使いたいので以下のように指定しました。
import { brewr } from 'chartjs-plugin-colorschemes/src/colorschemes/colorschemes.office';
Reactのファイルはこんな感じになります。
家計簿アプリを例に説明すると、今回はAPIを叩いてカテゴリごとの金額の合計を取得してセットしています。
import React, { useState, useEffect } from 'react';
import { Doughnut } from 'react-chartjs-2';
import { brewer } from 'chartjs-plugin-colorschemes';
import axios from 'axios';

const DoughnutChart = (props) => {
  const [chartData, setChartData] = useState({});

  useEffect(() => {
    getChartData();
  }, []);

  const getChartData = () => {
    axios
      .get("/api/getChartData")
      .then(res => {
        const expenses = res.data;
        let labels = [];
        let data = [];
        expenses.forEach(expense => {
          labels.push(expense.category);
          data.push(expense.money);
      });

      setChartData({
          labels:labels,
          datasets: [
            {
              label: labels,
              data: data,
              //ここはfalseに設定
              fill: false,
            }
          ]
        }
      );
    });
  };

  const options = {
    plugin: {
      colorschemes: {
        scheme: 'brewr.Paired12'
      }
    }
  };

  return (
    <React.Fragment>
        <Doughnut data={chartData} options={options}/>
    </React.Fragment>
  );
};

export default DoughnutChart;
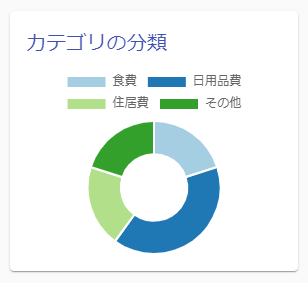
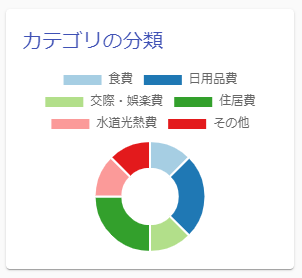
このコンポーネントを組み込んで表示するとこんな感じのおしゃれな配色のグラフが表示されます。

もし新たなカテゴリのデータが登録され、表示するデータが増えた際もカラースキームから色を割り振って表示してくれます。今回使っている「brewr.Paired12」の場合は12色まで対応可能です。

参考にさせて頂いたサイト
[Chart.js | Open source HTML5 Charts for your website]
(https://www.chartjs.org/)
[chartjs-plugin-colorschemes]
(https://nagix.github.io/chartjs-plugin-colorschemes/ja)
[jerairrest/react-chartjs-2: React wrapper for Chart.js - GitHub]
(https://github.com/jerairrest/react-chartjs-2)
[react-chartjs-2とChart.jsを使ってグラフを作ってみた - Qiita]
(https://qiita.com/tojimasan/items/7900bcfda37ef4635b3c)
