最近Reactを勉強しており、その際にグラフを作りたいと思いました。react-chartjs-2の提供もされていたので、今回は「Chart.js」を使用することにしました。
今回は線グラフですが、他にも円グラフや棒グラフなど色々あります。
https://jerairrest.github.io/react-chartjs-2/
また詳しい導入法は公式ドキュメントから確認できます。
https://github.com/jerairrest/react-chartjs-2
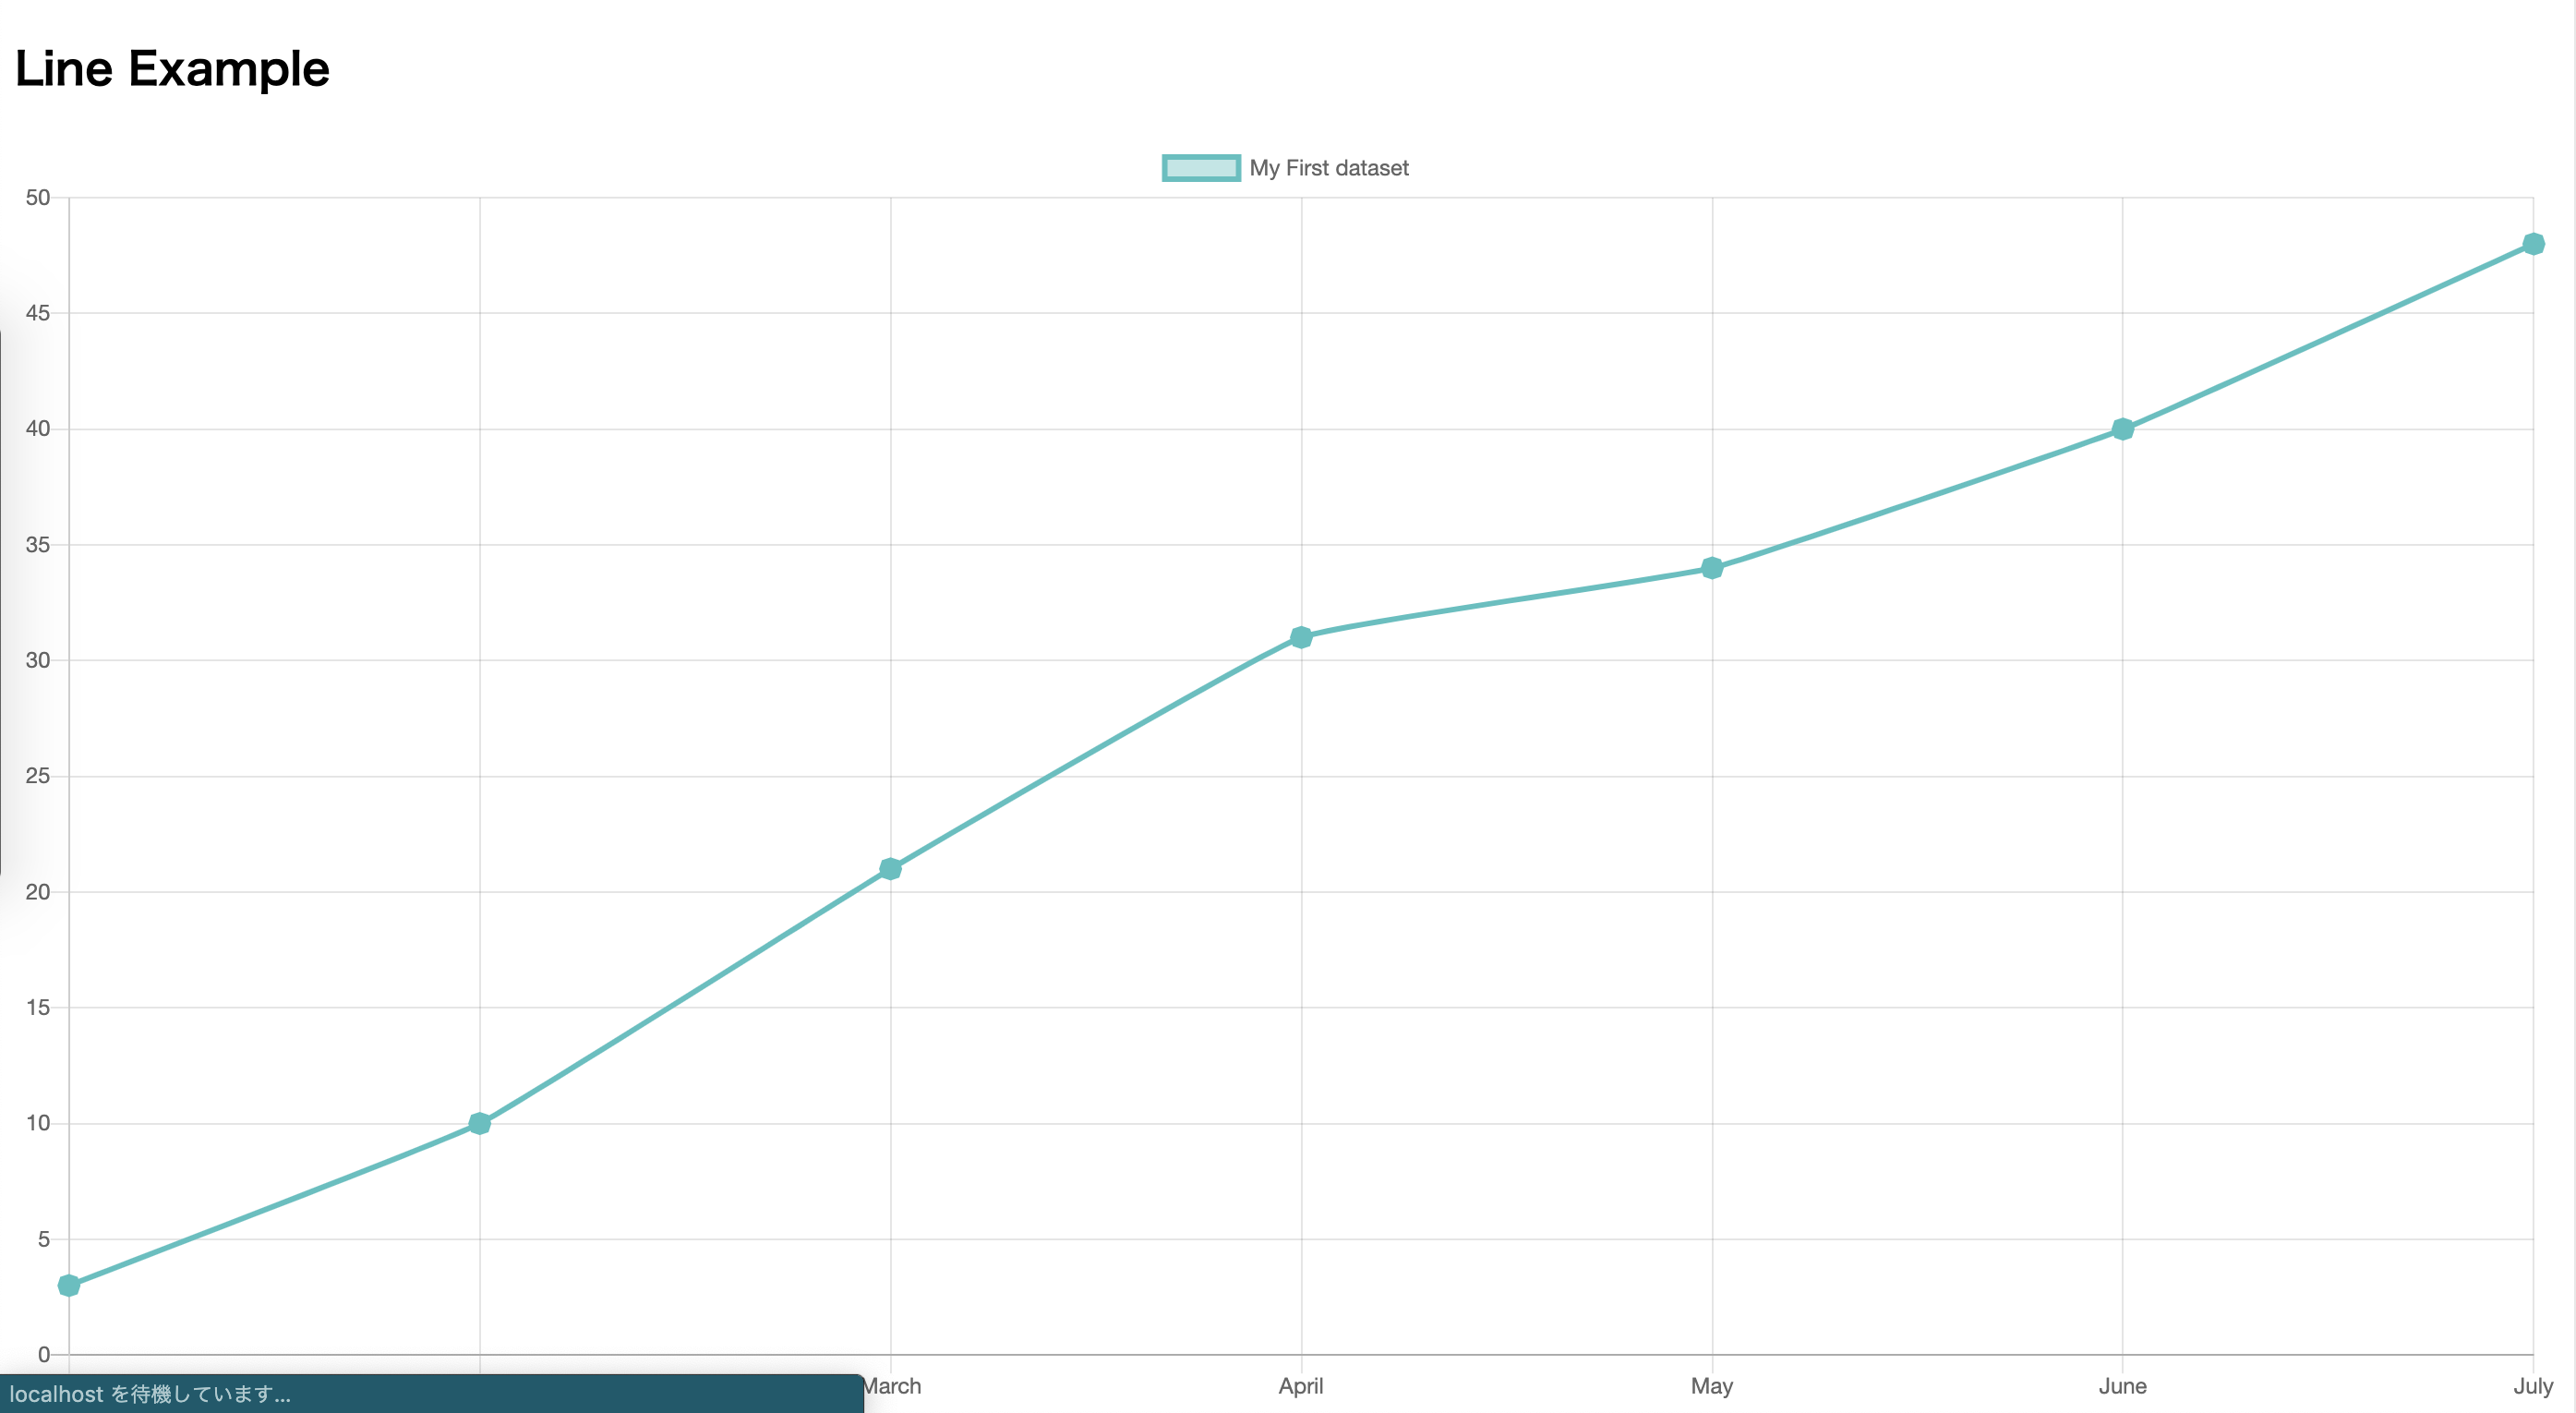
完成時のイメージとコードは下です。

必要となる「react-chartjs-2」と「chart.js」のインストール
yarn add react-chartjs-2 chart.js
import React from "react";
import LineExample from './Line';

function App() {
  return (
    <div className='App'>
      <LineExample />
    </div>
  );
}

export default App;
import React from 'react';
import {Line} from 'react-chartjs-2';

const data = {
  labels: ['January', 'February', 'March', 'April', 'May', 'June', 'July'],
  datasets: [
    {
      label: 'My First dataset',
      fill: true,
      lineTension: 0.1,
      backgroundColor: 'rgba(75,192,192,0.4)',
      borderColor: 'rgba(75,192,192,1)',
      borderCapStyle: 'round',
      borderDash: [],
      borderDashOffset: 0.0,
      borderJoinStyle: 'square',
      pointBorderColor: 'rgba(75,192,192,1)',
      pointBackgroundColor: '#eee',
      pointBorderWidth: 10,
      pointHoverRadius: 5,
      pointHoverBackgroundColor: 'rgba(75,192,192,1)',
      pointHoverBorderColor: 'rgba(220,220,220,1)',
      pointHoverBorderWidth: 1,
      pointRadius: 1,
      pointHitRadius: 10,
      data: [3, 10, 21, 31, 34, 40, 48]
    }
  ]
};

const LineExample = () => {
  return (
    <div>
      <h2>Line Example</h2>
      <Line data={data} />
    </div>
  );
}

export default LineExample;
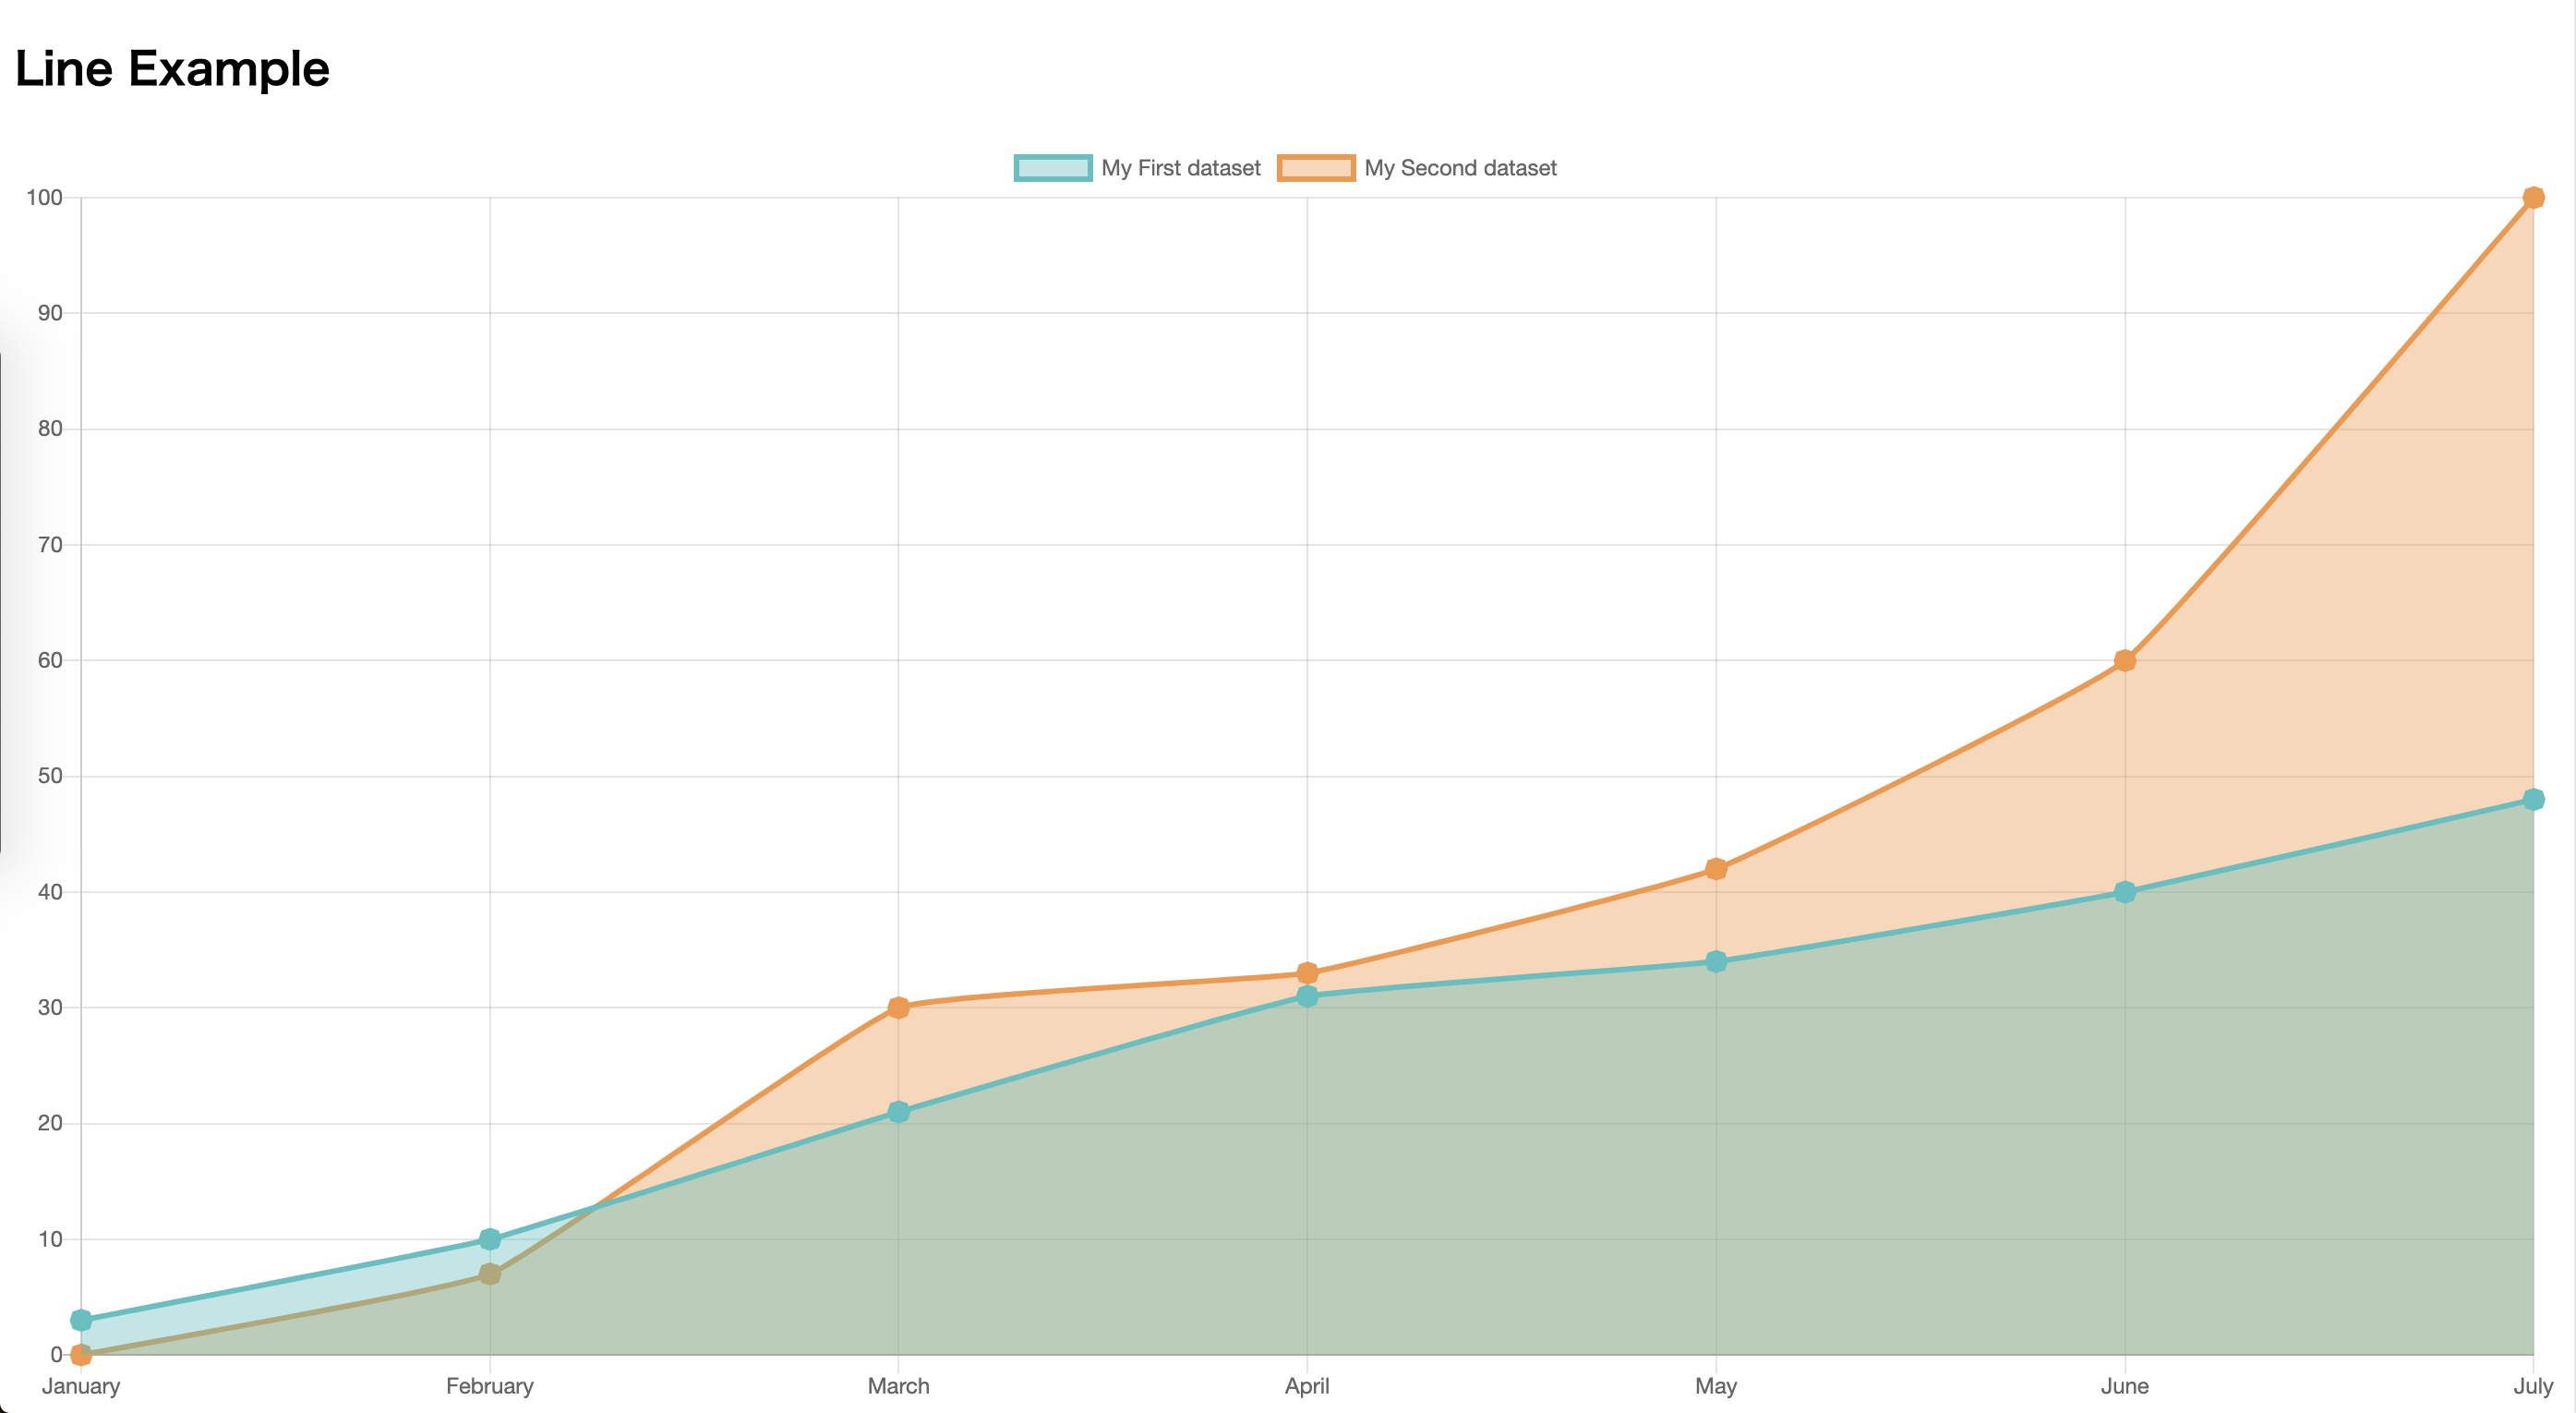
上の例では一つの線グラフでしたが、複数のグラフを表示することもデザインを加えることもできます。

複数のグラフを表示する方法がわからなかった時に参考になったstackoverflowも一緒にのせておきます。
create a multi line chart using Chart.js
参考文献
react-chartjs-2
react-chartjs-2のgithub
create a multi line chart using Chart.js