ご挨拶
今日から始まりました Machine Learning Advent Calendar 2013 幹事の @naoya_t です。今年もよろしくお願いします。
(日本時間では日が変わってしまいました。大変遅くなり申し訳ございません。アルゼンチン標準時(GMT-3)にはぎりぎり間に合いました!)
このアドベント・カレンダーの記事内容は、パターン認識・機械学習・自然言語処理・データマイニング等、データサイエンスに関する事でしたら何でもOKです。テーマに沿っていれば分量は問いません。(PRML, MLaPP等の読んだ箇所のまとめ、実装してみた、論文紹介、数式展開、etc.)
執筆する皆さんも読むだけの皆さんも共に楽しみましょう!
本日のお題
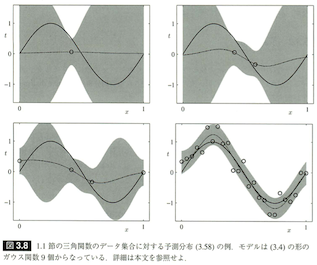
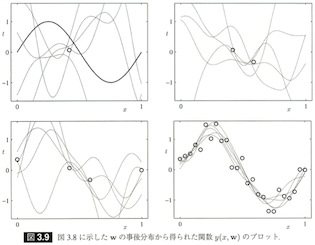
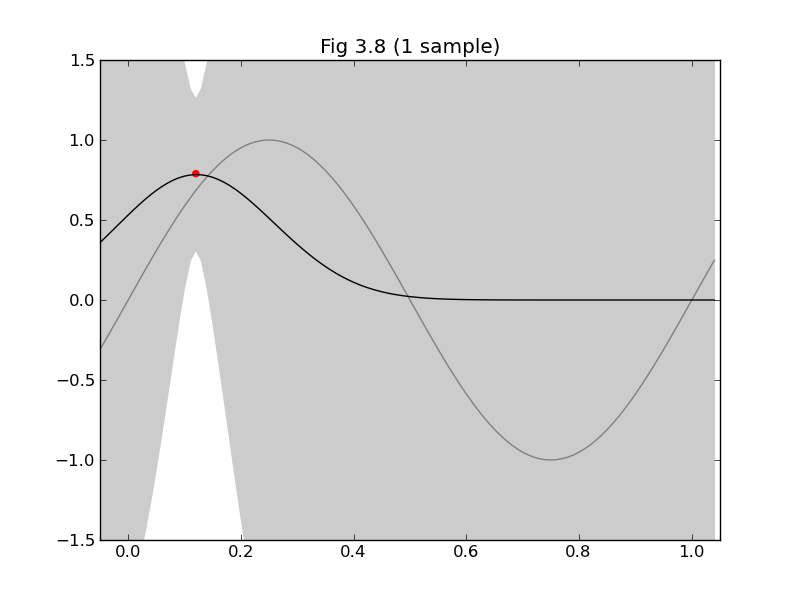
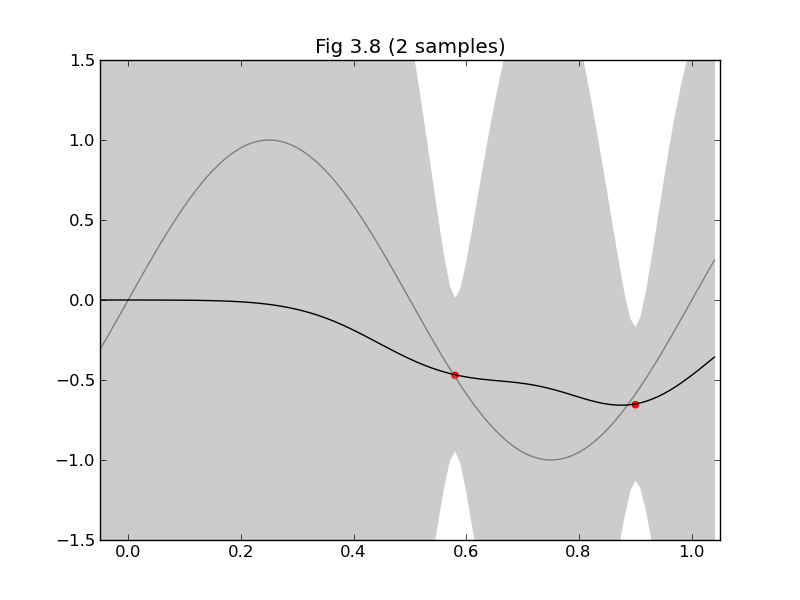
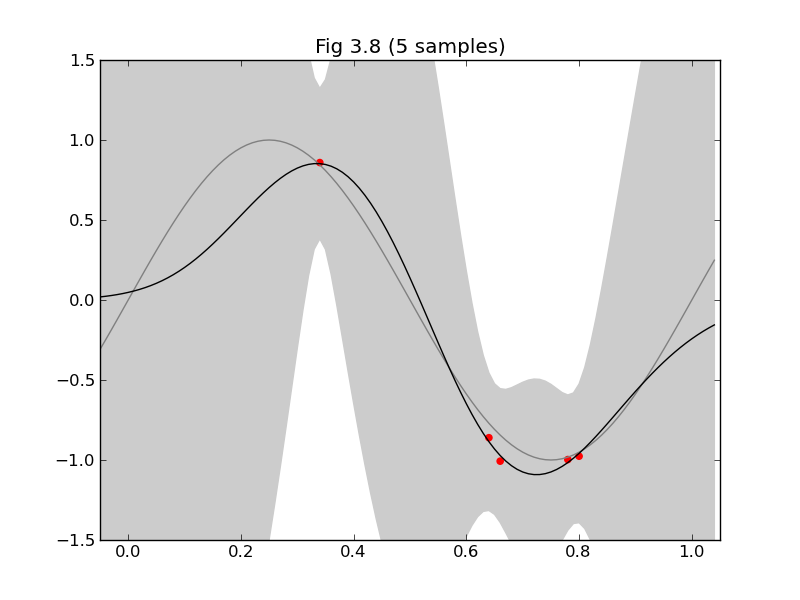
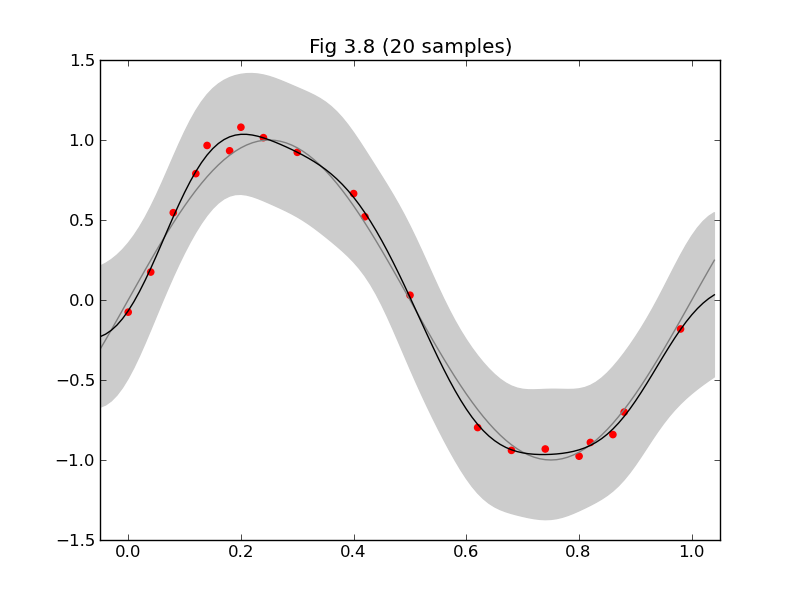
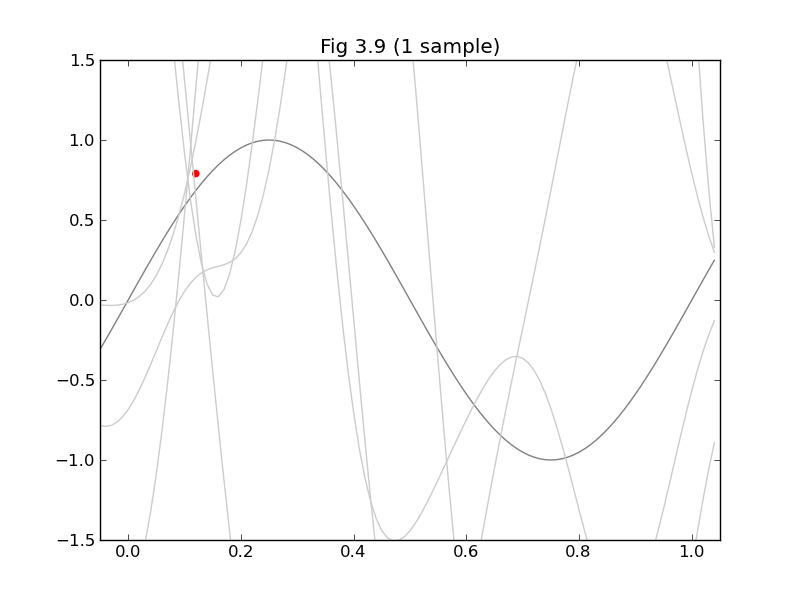
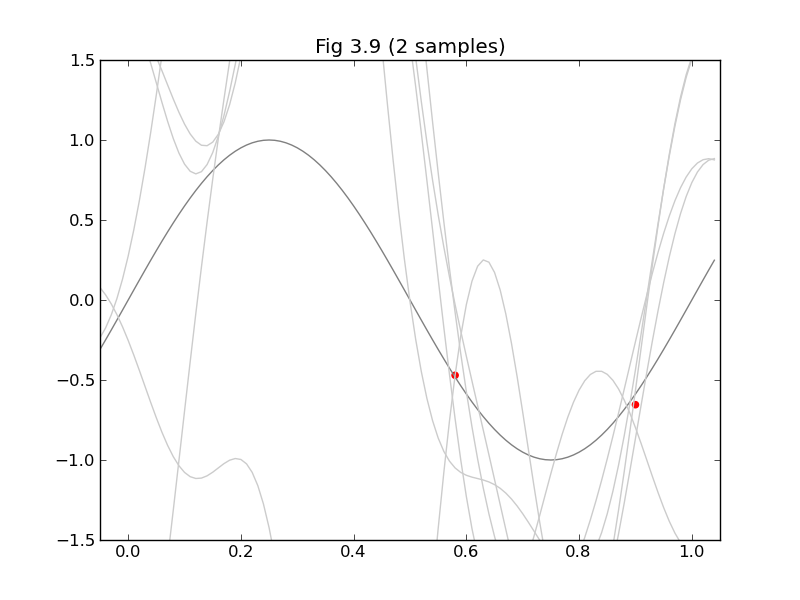
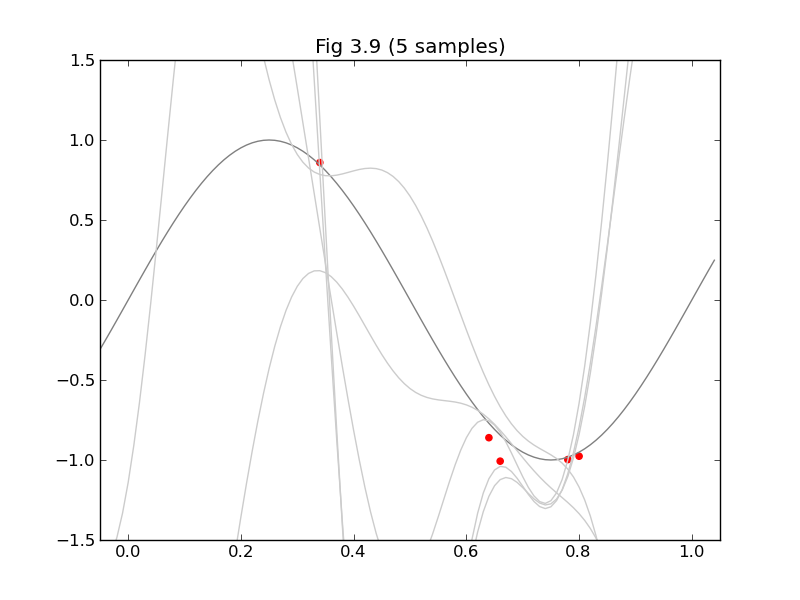
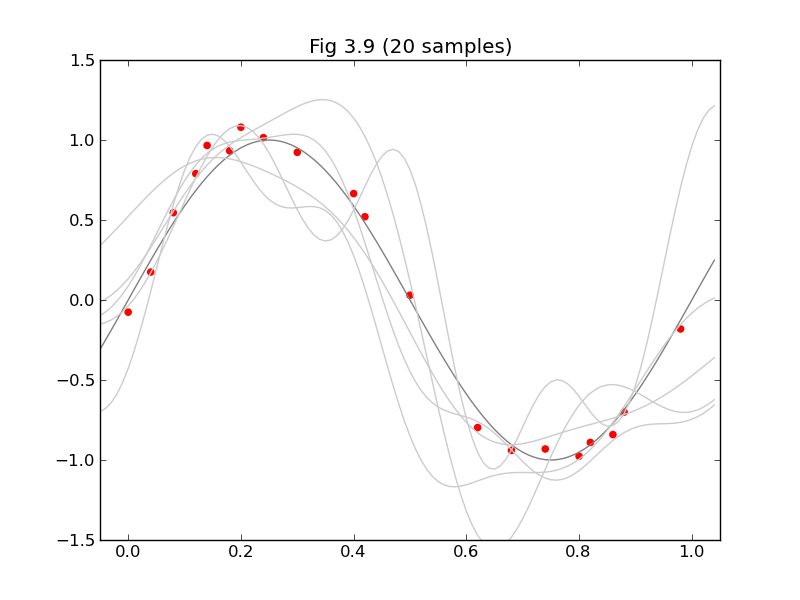
今日は、みんな大好きPRMLから軽めの話題ということで、§3.3の「ベイズ線形回帰」から、図3.8と図3.9を再現してみたいと思います。
等価カーネルの3Dグラフ(図3.10)も描こうと思っていたのですが時間切れでした。(気が向いたら追記します!)
必要な計算
図3.8のキャプションに「モデルは (3.4) の形のガウス(基底)関数9個からなっている」とあるので、
ガウス基底関数 $\phi_j(x)=exp\left(-\frac{(x-\mu_j)^2}{2s^2}\right)$ を x=[0,1] の範囲で適当に(というか均等に)9個並べてみることにします。
図3.8は予測分布 $p(t|\mathbf{x},\mathbf{t},\alpha,\beta)=N(t|\mathbf{m}_N\mathbf{\phi(x)},\sigma_N^2(\mathbf{x}))$ (3.58) の平均と分散が出せれば描けます。これに必要な
$\mathbf{m}_N$, $\mathbf{S}_N$, $\sigma_N^2(\mathbf{x})$ は
- $\mathbf{S}_N^{-1}=\alpha I+\beta\Phi^\mathrm{T}\Phi$ (3.54)
- $\mathbf{m}_N=\beta\mathbf{S}_N\Phi^\mathrm{T}\mathbf{t}$ (3.53)
- $\sigma_N^2(\mathbf{x})=\frac1\beta+\mathbf{\phi(x)}^\mathrm{T}\mathbf{S}_N\mathbf{\phi(x)}$ (3.59)
で求まります。ここで出てくる$\Phi$は皆さんお馴染みの計画行列 (3.16) です。基底関数 $\phi_j(x)$ と入力データ$\mathbf{x}$ から組み上げます。
図3.9は$\mathbf{w}$の事後分布 $p(\mathbf{w}|\mathbf{t})=N(\mathbf{w}|\mathbf{m}_N,\mathbf{S}_N)$ (3.49) から$\mathbf{w}$を5つずつサンプリングして、それぞれについて$y(x,\mathbf{w})=\mathbf{w}^\mathrm{T}\mathbf{\phi(x)}$をプロットするだけです。
コード
# !/usr/bin/env python
# -*- coding: utf-8 -*-

from pylab import *

S     = 0.1
ALPHA = 0.1
BETA  = 9

def sub(xs, ts):
    # φj(x) にガウス基底関数を採用
    def gaussian_basis_func(s, mu):
        return lambda x:exp(-(x - mu)**2 / (2 * s**2))

    # φ(x)
    def gaussian_basis_funcs(s, xs):
        return [gaussian_basis_func(s, mu) for mu in xs]

    xs9 = arange(0, 1.01, 0.125) # 9 points
    bases = gaussian_basis_funcs(S, xs9)

    N = size(xs) # データの点数
    M = size(bases) # 基底関数の数

    def Phi(x):
        return array([basis(x) for basis in bases])

    # Design matrix
    PHI = array(map(Phi, xs))
    PHI.resize(N, M)

    # predictive distribution
    def predictive_dist_func(alpha, beta):
        S_N_inv = alpha * eye(M) + beta * dot(PHI.T, PHI)
        m_N = beta * solve(S_N_inv, dot(PHI.T, ts)) # 20.1

        def func(x):
            Phi_x = Phi(x)
            mu = dot(m_N.T, Phi_x)
            s2_N = 1.0/beta + dot(Phi_x.T, solve(S_N_inv, Phi_x))
            return (mu, s2_N)

        return m_N, S_N_inv, func

    xmin = -0.05
    xmax =  1.05
    ymin = -1.5
    ymax =  1.5

    #
    # 図3.8
    #
    clf()
    axis([xmin, xmax, ymin, ymax])
    title("Fig 3.8 (%d sample%s)" % (N, 's' if N > 1 else ''))

    x_ = arange(xmin, xmax, 0.01)
    plot(x_, sin(x_*pi*2), color='gray')

    m_N, S_N_inv, f = predictive_dist_func(ALPHA, BETA)

    y_h = []
    y_m = []
    y_l = []
    for mu, s2 in map(f, x_):
        s = sqrt(s2)
        y_m.append(mu)
        y_h.append(mu + s)
        y_l.append(mu - s)

    fill_between(x_, y_h, y_l, color='#cccccc')
    plot(x_, y_m, color='#000000')

    scatter(xs, ts, color='r', marker='o')
    show()

    #
    # 図3.9
    #
    clf()
    axis([xmin, xmax, ymin, ymax])
    title("Fig 3.9 (%d sample%s)" % (N, 's' if N > 1 else ''))

    x_ = arange(xmin, xmax, 0.01)
    plot(x_, sin(x_*pi*2), color='gray')

    for i in range(5):
        w = multivariate_normal(m_N, inv(S_N_inv), 1).T
        y = lambda x: dot(w.T, Phi(x))[0]
        plot(x_, y(x_), color='#cccccc')

    scatter(xs, ts, color='r', marker='o')
    show()


def main():
    # サンプルデータ(ガウスノイズを付加します)
    xs = arange(0, 1.01, 0.02)
    ts = sin(xs*pi*2) + normal(loc=0.0, scale=0.1, size=size(xs))

    # サンプルデータから適当な個数だけ拾う
    def randidx(n, k):
        r = range(n)
        shuffle(r)
        return sort(r[0:k])

    for k in (1, 2, 5, 20):
        indices = randidx(size(xs), k)
        sub(xs[indices], ts[indices])


if __name__ == '__main__':
    main()
できた!
終わりに
去年は初日から飛ばし過ぎ的な指摘があったので、という訳ではなく執筆時間的な都合なのですが、今年はちょっと軽めなテーマ設定で皆さんのご期待に添えず申し訳ありません><
12/2の担当は @puriketu99 さんです。乞うご期待!
