「R を Ubuntu でインストールして csv からグラフを書く」
https://qiita.com/nanbuwks/items/f64de73537848a11649d
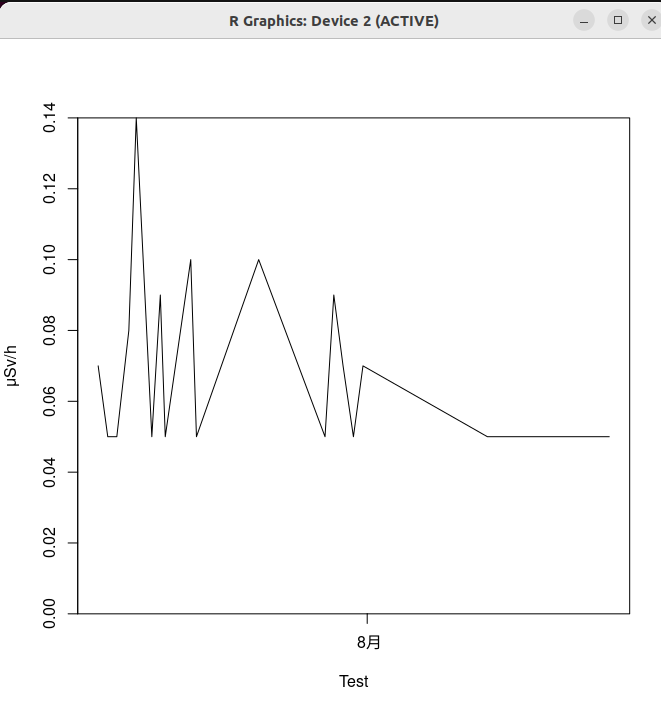
で測定値データから以下のようなグラフを作成しました。
さて、このグラフはマップにフキダシで表示していきたいので、体裁をそれにあわせて修正していきます。
原点を 0 にする
0の下にも余白が現れないようにします。
> plot(data[[3]],data[[4]],xlab="Test",ylab="μSv/h",type="l",ylim=c(0,max(data[[4]])),yaxs="i")
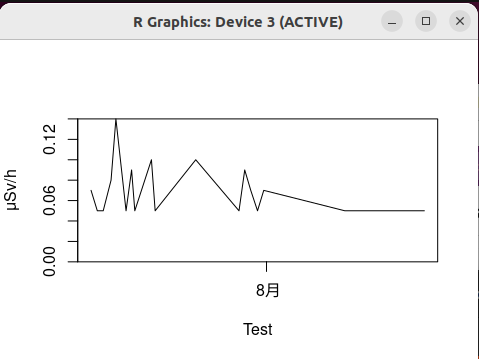
グラフのサイズをピクセルサイズで調整する
plot コマンドの前に png コマンドでスクリーンを作ります。
> png("plot1.png", width = 400, height = 200)
> plot(data[[3]],data[[4]],xlab="Test",ylab="μSv/h",type="l",ylim=c(0,max(data[[4]])),yaxs="i")
> dev.off()
うーん? どうもサイズがスクリーンピクセル値になっていませんね。unit="px" としても変わりませんでした。
96dpi でなんだか計算しているみたいです。
> dev.new(width = 480/96, height = 320/96, unit = "px")
> plot(data[[3]],data[[4]],xlab="Test",ylab="μSv/h",type="l",ylim=c(0,max(data[[4]])),yaxs="i")
としたらうまくいきました。サイズ指定中に演算を含めても大丈夫ですね。
ggplot でグラフを作る
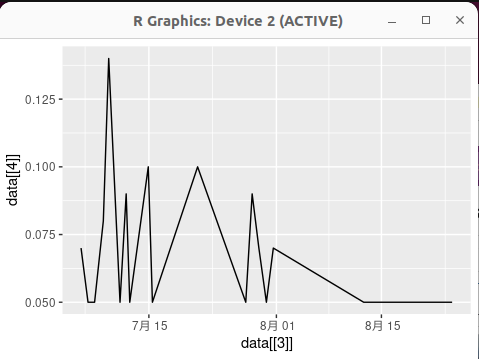
横軸ラベルをいい感じにするには、 ggplot を使うのが良さそうなので plot から変更してみました。
> library(ggplot2)
> dev.new(width = 480/96, height = 320/96, unit = "px")
> ggplot(aes(x = data[[3]], y = data[[4]]), data = data) + geom_line()
としたら
警告メッセージ:
1: Use of `data[[3]]` is discouraged. Use `.data[[3]]` instead.
2: Use of `data[[4]]` is discouraged. Use `.data[[4]]` instead.
が出たものの、以下のように表示されました。
ggplot で原点を調整
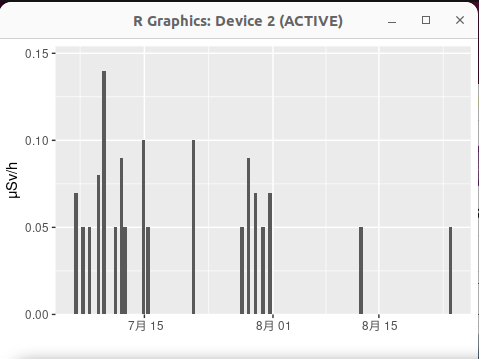
plot と同じように、原点を 0 に合わせてみました。軸ラベルをいい感じにし、グラフもスパイク形式にしてみました。
> ggplot(aes(x = data[[3]], y = data[[4]]), data = data) + geom_bar(stat="identity") + scale_y_continuous(expand = c(0, 0), limits = c(0, max(data[[4]])*1.1)) + xlab("")+ylab("μSv/h")
とりあえずこの形式を使うことにします。
png ファイルとして保存する
> png("plot1.png", width = 480, height = 320)
> ggplot(aes(x = data[[3]], y = data[[4]]), data = data) + geom_bar(stat="identity")  + scale_y_continuous(expand = c(0, 0), limits = c(0, max(data[[4]])*1.1)) + xlab("")+ylab("μSv/h")
> dev.off()
とすると plot1.png が生成されました。この場合、実ピクセル数でサイズ指定ができるようです。
スクリプト化する
以下の内容で makegraph.R ファイルを作ります。
library(ggplot2)
data <- read.csv("test3-100.csv")
data <- dplyr::mutate(data, 測定日時 = as.POSIXct(測定日時,tz="Asia/Tokyo"))
png("plot1.png", width = 480, height = 320)
ggplot(aes(x = data[[3]], y = data[[4]]), data = data) + geom_bar(stat="identity")  + scale_y_continuous(expand = c(0, 0), limits = c(0, max(data[[4]])*1.1)) + xlab("")+ylab("μSv/h")
dev.off()
以下で実行すると、plot1.png が生成されます。
$ Rscript makegraph.R
入力・出力ファイルを変数化する
makegraph.R を
library(ggplot2)
args <- commandArgs(trailingOnly = TRUE)
input_file <- args[1]
output_file <- args[2]
data <- read.csv(input_file)
data <- dplyr::mutate(data, 測定日時 = as.POSIXct(測定日時,tz="Asia/Tokyo"))
png(output_file, width = 480, height = 320)
ggplot(aes(x = data[[3]], y = data[[4]]), data = data) + geom_bar(stat="identity")  + scale_y_continuous(expand = c(0, 0), limits = c(0, max(data[[4]])*1.1)) + xlab("")+ylab("μSv/h")
dev.off()
として、
$ Rscript makegraph.R test3-100.csv plot2.png
とすると plot2.png に出力されます。


