Ubuntu で Processing
「導電布タッチセンサーモジュール nüno ver.2 を無線と ESP32 で使ってみる」
https://qiita.com/nanbuwks/items/eac827904c604f13f1ce
のコードをESP32に使うと、
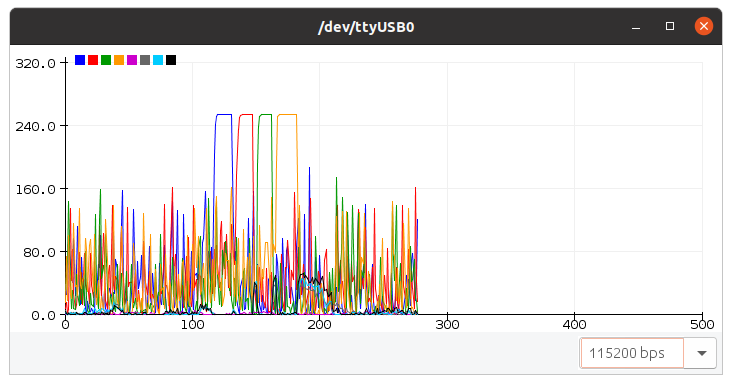
Arduino開発環境に備え付けのシリアルプロッタで可視化できます。
同じコードを使い、Processingでも見栄えの良い結果が取得できます。
import processing.serial.*;

// グラフデザインのパラメータ
final int screen_w = 940;          // 画面サイズの幅[ドット]
final int screen_h = 480;          // 画面サイズの高さ[ドット]
final int v_margin = 20;           // グラフ領域上下のマージン[ドット]
final int line_graph_w = 600;      // 線グラフの幅[ドット = 表示サンプル数]

final float max_data_val = 180.0f; // データの最大値
final boolean signed_data = true;  // マイナス値もあるか?
final int num_auxline = 4;         // 補助線の数[本]
final int vallabel_w = 60;         // 補助線の数値表示の幅[ドット]

final int num_bar = 12;             // 数値バーの数[個]
final int bar_size = 70;           // 数値バーの幅[パーセント]


// グラフ描画用の定数変数
  // グラフ描画領域の幅
  final int plotarea_w = (screen_w - vallabel_w);
  // グラフ描画領域の高さ
  final int plotarea_h = (screen_h - 2 * v_margin);
  // 棒グラフ描画領域の左座標
  final int bar_graph_x = (vallabel_w + line_graph_w);
  // 棒グラフ描画領域の幅
  final int bar_graph_w = (plotarea_w - line_graph_w);
  // 線グラフ描画領域の左座標
  final int line_graph_x = vallabel_w;

  // 符号有無を考慮した補助線の数
  final int num_net_axuline = (signed_data? 2: 1) * num_auxline;
  // Y=0.0となる補助線のインデックス
  final int main_axis = num_auxline;
  // 符号有無を考慮したデータ範囲
  final float plotarea_range = (signed_data? 2.0f: 1.0f) * max_data_val;

  // バーの幅
  final int bar_w = bar_size * bar_graph_w / (100 * num_bar);
  // Y=0.0となる高さ座標
  final int bar_y = (signed_data? (screen_h/2): (screen_h-v_margin));

// シリアルポート
Serial myPort;

// Arduinoから受け取ったデータ数とその配列
int numData;
float[] data = new float [num_bar];

// グラフ表示用のリングバッファ
int graph_write_pos;
float[][] graph_data = new float[num_bar][line_graph_w];

// 初期化
void setup()
{
  // ウィンドウを作成
  // 引数に変数指定できない??
  size(940, 480);
//  size(screen_w, screen_h);

  // シリアルポートを初期化
  println(">Serial.list()");
  for(int i = 0; i < Serial.list().length; i++)
  {
    println("[" + i + "] " + Serial.list()[i]);
  }
  // ポートとデータ転送レートを書き換えてください。
  // データ転送レート[4800, 9600, 14400, 19200, 28800, 38400, 57600, 115200]
  String portName = Serial.list()[32];
  myPort = new Serial(this, portName, 115200);

  // 画面の更新頻度を設定
  frameRate(3);
}

// キー入力
void keyPressed()
{
  // Arduinoに送る
  myPort.write(key);
}

// データ更新カウンタ(1秒ごとにリセット)
int update_counter;
// 直前の1秒間のデータ更新数
int update_rate;
// 直前のリセット時のリアルタイムクロック[ミリ秒]
int update_timer0;
// プログラムの動作インジケータのアニメーションカウンタ
int update_anim;

// データ更新頻度表示
void showUpdateRate(boolean update)
{
  // データ更新をカウントアップ
  if(update)
  {
    update_counter++;
  }

  // 1秒おきに表示を更新
  int t = millis();
  if(1000 <= (t - update_timer0))
  {
    update_rate = update_counter;
    update_counter = 0;
    update_timer0 = t;
  }

  // 更新頻度の表示
  textSize(14);
  textAlign(RIGHT, TOP);
  fill(192);
  String str = "Update/Sec:" +  update_rate;
  text(str, screen_w-20, 0);
  // プログラムの動作インジケータアニメーションの表示
  String[] anim = { "-", "\\", "|", "/" };
  text(anim[update_anim/8], screen_w-4, 0);
  update_anim = (update_anim < 4*8-1)? update_anim+1: 0;
}

// Arduinoからのデータ受信
boolean readFromSerial()
{
  // シリアルポートが空なら何もしない
  boolean updateData = false;
  if(0 < myPort.available())
  {
    // シリアルから1行読み込み
    String str = myPort.readStringUntil('\n');
    if(str != null)
    {
      // 行頭が'>'ならばデータ受信、そうでなければメッセージ受信
      if(str.charAt(0) == '>')
      {
        // カンマ区切りでトークンを分解
        // 表示できるデータの最大数は num_bar 個
        str = trim(str);
        String toks[] = split(str.substring(1), ",");
        numData = min(toks.length, num_bar);
        for(int i = 0; i < numData; i++){
          data[i] = float(toks[i]);
  //        println("[" + i + "]" + toks[i]);
        }
        updateData = true;
      }
      else
      {
        // データでないメッセージはそのままコンソールに表示
        print(str);
      }
    }
  }
  return updateData;
}

// 補助線とラベルの表示
void drawAxuLine()
{
  textSize(14);
  textAlign(RIGHT, CENTER);
  for(int y = 0; y <= num_net_axuline; y++)
  {
    // 補助線のy座標を計算
    int yy = v_margin + (y * plotarea_h / num_net_axuline);
    // 補助線の色を決める(Y=0.0が明るく、他は暗い灰色)
    int c = (y == main_axis)? 192: 64;
    stroke(c);
    fill(c);
    // 補助線を引く
    line(vallabel_w, yy, screen_w, yy);
    // ラベルを書く
    float val = max_data_val - (y * max_data_val / num_auxline);
    text(nf(val,1,1), vallabel_w-2, yy);
  }
  // 線グラフの1秒間隔の補助線を引く
  stroke(32);
  for(int t = 0; t <= line_graph_w; t += 60)
  {
    int x = line_graph_x + line_graph_w - t;
    line(x, v_margin, x, screen_h-v_margin);
  }
}

// グラフの色(黒と白を除く6色の繰り返し)
final int graph_color[][] = {
  { 180,0,60},{255,0,0 },{ 255,100,0 },{ 220,220,0 },{ 120,255,0 },{ 0,230,0 },{ 0,155,190 },{85,0,255},{170,0,200}
};

// 描画
void draw()
{
  // 画面クリア
  background(0);

  // Arduinoからのデータ受信
  boolean updateData = readFromSerial();

  // リングバッファに格納
  for(int i = 0; i < numData; i++){
    graph_data[i][graph_write_pos] = data[i];
  }
  graph_write_pos = (graph_write_pos < line_graph_w-1)? graph_write_pos+1: 0;

  // 補助線とラベルの表示
  drawAxuLine();

  // データ更新頻度表示
  showUpdateRate(updateData);

  // グラフ表示
  textSize(14);
  textAlign(CENTER, TOP);
  for(int i = 0; i < numData; i++)
  {
    // 棒グラフの中心座標と高さを計算
    int x = bar_graph_x + ((2 * i + 1) * bar_graph_w / (2 * num_bar));
    int y = int(-plotarea_h * data[i] / plotarea_range);

    // 棒グラフの描画
    int c = (i % 8) + 1;
    fill(graph_color[c][0], graph_color[c][1], graph_color[c][2]);
    noStroke();
    rect(x-(bar_w/2), bar_y, bar_w, y);

    // データ値を表示
    int ty = bar_y + y + ((0.0f <= data[i])? -16: +0);
    text(nf(data[i],1,1), x, ty);

    // 線グラフの表示
    stroke(graph_color[c][0], graph_color[c][1], graph_color[c][2]);
    int k = graph_write_pos;
    y = bar_y + int(-plotarea_h * graph_data[i][k] / plotarea_range);
    for(int j = 0; j < line_graph_w-1; j++)
    {
      k = (k < line_graph_w-1)? k+1: 0;
      int yy = bar_y + int(-plotarea_h * graph_data[i][k] / plotarea_range);
      line(line_graph_x+j, y, line_graph_x+j+1, yy);
      y = yy;
    }
  }
}
