基本情報技術者試験のアルゴリズム対策を始めましたので、基礎的なソートプログラムをPythonで書いてみました。下記コードを実行すれば同じようなグラフが描画できると思います。間違いがあればご指摘していただければ幸いです。
使用した言語/ツール
- Python
- Jupyter Notebook
今回登場するソートアルゴリズム
- バブルソート
- 選択ソート
- 挿入ソート
- シェルソート
まずは結果のグラフ
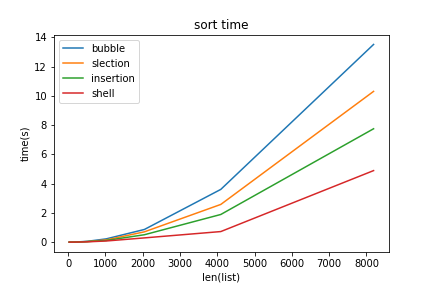
xは32, 64, 128, 256, 512, 1024, 2048, 4096, 8192個のランダムな数値(1から50000)が入ったリストです。
縦軸には実行時間をとっています。
コード
間違いがあれば指摘していただければ幸いです。
import copy
import random
import time


def bubble_sort(list_data):
    start = time.time()
    sample_data = copy.copy(list_data)
    for h in range(len(sample_data)):
        for i in range(len(sample_data)-1):

            if sample_data[i] > sample_data[i+1]:
                a = sample_data[i]
                b = sample_data[i+1]
                sample_data[i] = b
                sample_data[i+1] = a
    end = time.time()
    result = end - start
    return sample_data, result


def selection_sort(list_data):
    start = time.time()
    sample_data = copy.copy(list_data)
    for h in range(len(sample_data)):
        m = 0
        for i in range(len(sample_data)-h):
            if sample_data[m] < sample_data[i]:
                m = i
            if i == len(sample_data)-1-h:
                work = sample_data[i]
                sample_data[i] = sample_data[m]
                sample_data[m] = work
                continue

    end = time.time()
    result = end - start
    return sample_data, result


def insertion_sort(list_data):
    start = time.time()
    sample_data = copy.copy(list_data)
    for i in range(1, len(sample_data)):
        if sample_data[i-1] > sample_data[i]:
            j = i
            while j > 0 and sample_data[j-1] > sample_data[j]:
                work = sample_data[j]
                sample_data[j] = sample_data[j-1]
                sample_data[j-1] = work
                j -= 1

    end = time.time()
    result = end - start
    return sample_data, result


def shell_sort(list_data):
    start = time.time()
    sample_data = copy.copy(list_data)

    h = 1
    while h < len(sample_data) / 9:
        h = h * 3 + 1

    while h > 0:
        for i in range(h, len(sample_data)):
            if sample_data[i-h] > sample_data[i]:
                j = i
                while j > 0 and sample_data[j-h] > sample_data[j]:
                    work = sample_data[j]
                    sample_data[j] = sample_data[j-h]
                    sample_data[j-h] = work
                    j -= 1

        h = h // 3

    end = time.time()
    result = end - start
    return sample_data, result


time_bubble = list()
time_selection = list()
time_insertion = list()
time_shell = list()
for i in range(5,14):
    num = 2**i
    print(num)
    random.seed(1)
    samples = random.sample(range(1, 50000), k=num)
    time_bubble.append(round(bubble_sort(samples)[1], 5))
    time_selection.append(round(selection_sort(samples)[1], 5))
    time_insertion.append(round(insertion_sort(samples)[1], 5))
    time_shell.append(round(shell_sort(samples)[1], 5))

# print("{:<16}".format("bubble"), time_bubble)
# print("{:<16}".format("selection"), time_selection)
# print("{:<16}".format("insertion"), time_insertion)
# print("{:<16}".format("shell"), time_shell)
グラフの描画
%matplotlib inline

import numpy as np
import matplotlib.pyplot as plt

x = [32, 64, 128, 256, 512, 1024, 2048, 4096, 8192]
y_bubble = time_bubble
y_selection = time_selection
y_insertion = time_insertion
y_shell = time_shell

plt.title("sort time")
plt.xlabel("len(list)")
plt.ylabel("time(s)")
plt.plot(x, y_bubble, label="bubble")
plt.plot(x, y_selection, label="slection")
plt.plot(x, y_insertion, label="insertion")
plt.plot(x, y_shell, label="shell")
plt.legend()
上のコードの数値を変えれば数字の個数を変更できます。
現在は2の5乗から2の13乗までになっています。
for i in range(5,14):
    num = 2**i
    print(num)
    random.seed(1)
    samples = random.sample(range(1, 50000), k=num)
今回わかったこと
- 個数が多いとシェルソートは速い。
- シェルは開発者の名前。
- こういう作業はJupyter Notebookを使うと調子がいいとわかった。
おわりに
実行する環境によって細かな描画が変わってくると思います。ご了承ください。