
2年程前に書いた記事に掲載したPythonコードは、そのままでは M5Stack GPS unit v1.1 の NMEA を正しくエンコードできませんでした。NMEA 4.10 に対応していないからです。別途、NMEA 4.10 対応にアップデートします。
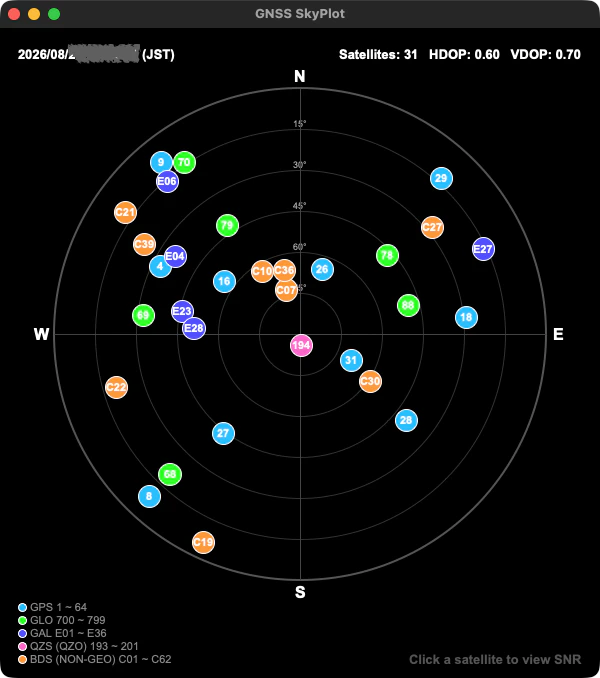
今回は、M5Stack GPS unit v1.1 が マルチGNSS対応であるため、衛星配置図を 衛星別にカラーで描いてみました。眺めていると、衛星の移動が面白いです。
引数でシリアルポート(COMポート)を指定します。
$ python sky-slot.py /dev/cu.usbserial-0001
sky-slot.py
import sys
import math
import threading
import serial
import tkinter as tk
from datetime import datetime, timedelta

if len(sys.argv) < 2:
    print(f"Usage: {sys.argv[0]} com-port")
    sys.exit()

SERIAL_PORT = sys.argv[1]

# --- 設定 ---
BAUDRATE = 115200

# 共有オブジェクト(時刻、DOP、衛星データ)
satellites = {}
dop_data = {'hdop': 0.0, 'vdop': 0.0}
time_data = {'jst_str': '----/--/-- --:--:--'}
data_lock = threading.Lock()

def parse_nmea(line):
    """NMEA 4.10のGSV文、GSA文、RMC文をパースする"""
    if not (line.startswith('$') and '*' in line):
        return

    try:
        raw_sentence, _ = line.split('*', 1)
        parts = raw_sentence.split(',')
    except Exception:
        return

    if len(parts) == 0:
        return

    sentence_type = parts[0]
    if not isinstance(sentence_type, str):
        return

    # --- 1. RMC文からUTCの時刻と日付を取得し、JST(+9時間)に変換 ---
    if sentence_type.endswith('RMC'):
        try:
            if len(parts) >= 10:
                time_str = parts[1].strip()  # hhmmss.ss
                date_str = parts[9].strip()  # ddmmyy

                if time_str and date_str:
                    hh, mm, ss = int(time_str[0:2]), int(time_str[2:4]), int(time_str[4:6])
                    dd, mn, yy = int(date_str[0:2]), int(date_str[2:4]), int(date_str[4:6]) + 2000

                    # UTCからJSTへ変換
                    utc_time = datetime(yy, mn, dd, hh, mm, ss)
                    jst_time = utc_time + timedelta(hours=9)

                    with data_lock:
                        time_data['jst_str'] = jst_time.strftime("%Y/%m/%d %H:%M:%S (JST)")
        except Exception:
            pass
        return

    # --- 2. GSA文から全体DOPを抽出 ---
    if sentence_type.endswith('GSA'):
        try:
            if len(parts) >= 18:
                hdop_str = parts[16].strip()
                vdop_str = parts[17].strip()
                with data_lock:
                    dop_data['hdop'] = float(hdop_str) if hdop_str else 0.0
                    dop_data['vdop'] = float(vdop_str) if vdop_str else 0.0
        except Exception:
            pass
        return

    # --- 3. GSV文から衛星位置と個別SNR情報を抽出 ---
    if not sentence_type.endswith('GSV'):
        return

    if len(sentence_type) < 3:
        return
    talker = sentence_type[1:3]

    if talker == 'GP': sys_id = 'GPS'
    elif talker == 'GL': sys_id = 'GLO'
    elif talker == 'GA': sys_id = 'GAL'
    elif talker in ['GQ', 'QZ']: sys_id = 'QZS'
    elif talker in ['GB', 'BD']: sys_id = 'BDS'
    else: return

    try:
        num_fields = len(parts)
        for i in range(4, num_fields - 3, 4):
            if i + 3 >= num_fields: break
            prn_str = parts[i].strip()
            elev_str = parts[i+1].strip()
            azim_str = parts[i+2].strip()
            snr_str = parts[i+3].strip()

            if not prn_str: continue
            prn = int(prn_str)
            elev = float(elev_str) if elev_str else 0.0
            azim = float(azim_str) if azim_str else 0.0
            snr = float(snr_str) if snr_str else 0.0

            if sys_id == 'QZS' and (1 <= prn <= 10):
                prn = prn + 192

            with data_lock:
                if elev == 0.0 and azim == 0.0 and snr == 0.0:
                    satellites.pop((sys_id, prn), None)
                else:
                    satellites[(sys_id, prn)] = {'elevation': elev, 'azimuth': azim, 'snr': snr}
    except Exception:
        pass

def serial_reader():
    """シリアルポートからデータを読み込むスレッド関数"""
    try:
        with serial.Serial(SERIAL_PORT, BAUDRATE, timeout=1) as ser:
            while True:
                line = ser.readline().decode('ascii', errors='ignore').strip()
                if line: parse_nmea(line)
    except Exception as e:
        print(f"シリアルエラー: {e}", file=sys.stderr)

class SkyPlotApp(tk.Tk):
    def __init__(self):
        super().__init__()
        self.title("GNSS SkyPlot")
        self.geometry("600x650")

        self.canvas = tk.Canvas(self, bg="#000000", highlightthickness=0)
        self.canvas.pack(fill=tk.BOTH, expand=True)

        self.system_styles = {
            'GPS': ('#00bfff', '', False, 'GPS 1 ~ 64'),
            'GLO': ('#00ff00', '', False, 'GLO 65 ~ 96'),
            'GAL': ('#4d4dff', 'E', True, 'GAL E01 ~ E36'),
            'QZS': ('#ff66cc', '', False, 'QZS 193 ~ 201'),
            'BDS': ('#ff9933', 'C', True, 'BDS C01 ~ C62')
        }

        self.selected_satellite = None

        self.canvas.bind("<Configure>", self.on_resize)
        self.canvas.bind("<Button-1>", self.on_canvas_click)

        self.update_loop()

    def on_resize(self, event):
        self.draw_all()

    def on_canvas_click(self, event):
        click_x = event.x
        click_y = event.y
        nearest_sat = None
        min_dist = 15.0

        with data_lock:
            current_sats = list(satellites.items())

        for (sys_id, prn), info in current_sats:
            elev = info['elevation']
            azim = info['azimuth']
            r = self.max_r * (90.0 - elev) / 90.0
            theta = math.radians(90.0 - azim)
            x = self.cx + r * math.cos(theta)
            y = self.cy - r * math.sin(theta)

            dist = math.sqrt((click_x - x)**2 + (click_y - y)**2)
            if dist < min_dist:
                min_dist = dist
                nearest_sat = (sys_id, prn)

        if self.selected_satellite == nearest_sat:
            self.selected_satellite = None
        else:
            self.selected_satellite = nearest_sat
        self.draw_all()

    def draw_all(self):
        """画面全体の再描画処理"""
        self.canvas.delete("all")

        w = self.canvas.winfo_width()
        h = self.canvas.winfo_height()
        self.cx = w / 2
        self.cy = h / 2 - max(10, int(h * 0.03))
        self.max_r = min(self.cx, self.cy) * 0.82

        if self.max_r <= 0: return

        # 1. 背景のグリッド(同心円・十字線)の描画
        angles = list(range(15, 90, 15))
        for ang in angles:
            r = self.max_r * (90 - ang) / 90
            self.canvas.create_oval(self.cx - r, self.cy - r, self.cx + r, self.cy + r, outline="#333333", width=1)
            self.canvas.create_text(self.cx, self.cy - r, text=f"{ang}°", fill="#aaaaaa", font=("Arial", max(7, int(self.max_r * 0.025))), anchor="s")

        self.canvas.create_oval(self.cx - self.max_r, self.cy - self.max_r, self.cx + self.max_r, self.cy + self.max_r, outline="#555555", width=2)
        self.canvas.create_line(self.cx, self.cy - self.max_r, self.cx, self.cy + self.max_r, fill="#444444")
        self.canvas.create_line(self.cx - self.max_r, self.cy, self.cx + self.max_r, self.cy, fill="#444444")

        # 方位ラベル
        pad = max(10, int(self.max_r * 0.05))
        lbl_font = ("Arial", max(10, int(self.max_r * 0.05)), "bold")
        self.canvas.create_text(self.cx, self.cy - self.max_r - pad, text="N", fill="#ffffff", font=lbl_font)
        self.canvas.create_text(self.cx + self.max_r + pad, self.cy, text="E", fill="#ffffff", font=lbl_font)
        self.canvas.create_text(self.cx, self.cy + self.max_r + pad, text="S", fill="#ffffff", font=lbl_font)
        self.canvas.create_text(self.cx - self.max_r - pad, self.cy, text="W", fill="#ffffff", font=lbl_font)

        # 2. 画面左上へ RMC から取得した JST をリアルタイム表示
        with data_lock:
            jst_text_str = time_data['jst_str']
            hdop_val = dop_data['hdop']
            vdop_val = dop_data['vdop']
            current_sats = list(satellites.items())

        top_left_x = max(15, int(w * 0.03))
        top_y = max(15, int(h * 0.03))
        panel_font = ("Arial", max(10, int(self.max_r * 0.038)), "bold")
        self.canvas.create_text(top_left_x, top_y, text=jst_text_str, fill="#ffffff", font=panel_font, anchor="nw")

        # 3. 画面右上へ現在の総衛星数と HDOP / VDOP をリアルタイム表示
        top_right_x = w - max(15, int(w * 0.03))
        sat_count = len(current_sats) # 現在保持している衛星のトータル数をカウント
        dop_text = f"Satellites: {sat_count:02d}   HDOP: {hdop_val:.2f}   VDOP: {vdop_val:.2f}"
        self.canvas.create_text(top_right_x, top_y, text=dop_text, fill="#ffffff", font=panel_font, anchor="ne")

        # 4. 凡例(左下)の描画
        legend_x = max(15, int(w * 0.03))
        legend_step = max(13, int(self.max_r * 0.042))
        legend_font_size = max(8, int(self.max_r * 0.028))
        legend_y_start = h - max(15, int(h * 0.03))

        for idx, (sys_name, style_tuple) in enumerate(reversed(list(self.system_styles.items()))):
            color = style_tuple[0]
            text_str = style_tuple[3]

            y_pos = legend_y_start - (idx * legend_step)
            marker_size = max(4, int(legend_font_size * 0.4))

            self.canvas.create_oval(legend_x, y_pos - marker_size, legend_x + marker_size*2, y_pos + marker_size, fill=color, outline="#ffffff", width=1)
            self.canvas.create_text(legend_x + (marker_size * 3), y_pos, text=text_str, fill="#888888", font=("Arial", legend_font_size), anchor="w")

        # 5. 選択された個別衛星の SNR 表示(右下)
        info_x, info_y = w - max(15, int(w * 0.03)), h - max(15, int(h * 0.03))
        if self.selected_satellite:
            sys_name, prn = self.selected_satellite
            sat_info = next((info for (s_id, p_num), info in current_sats if s_id == sys_name and p_num == prn), None)
            style_data = self.system_styles.get(sys_name, ('#888888', '', False, ''))
            prefix, zero_pad = style_data[1], style_data[2]
            sat_name = f"{prefix}{prn:02d}" if zero_pad else f"{prefix}{prn}"
            info_text = f"Selected: {sat_name}  |  SNR: {sat_info['snr']:.1f} dB-Hz" if sat_info else f"Selected: {sat_name}  |  SNR: ---"
            self.canvas.create_text(info_x, info_y, text=info_text, fill="#00ffff", font=panel_font, anchor="e")
        else:
            self.canvas.create_text(info_x, info_y, text="Click a satellite to view SNR", fill="#555555", font=panel_font, anchor="e")

        # 6. 衛星プロットの描画
        for (sys_id, prn), info in current_sats:
            r = self.max_r * (90.0 - info['elevation']) / 90.0
            theta = math.radians(90.0 - info['azimuth'])
            x, y = self.cx + r * math.cos(theta), self.cy - r * math.sin(theta)
            color, prefix, zero_pad, _ = self.system_styles.get(sys_id, ('#888888', '', False, ''))
            sat_size = max(10, min(16, self.max_r * 0.045))

            if self.selected_satellite == (sys_id, prn):
                self.canvas.create_oval(x - sat_size - 4, y - sat_size - 4, x + sat_size + 4, y + sat_size + 4, outline="#ffffff", width=2)
            self.canvas.create_oval(x - sat_size, y - sat_size, x + sat_size, y + sat_size, fill=color, outline="#ffffff", width=1)
            label_text = f"{prefix}{prn:02d}" if zero_pad else f"{prefix}{prn}"
            self.canvas.create_text(x, y, text=label_text, fill="#ffffff", font=("Arial", max(6, int(sat_size * 0.75)), "bold"))

    def update_loop(self):
        self.draw_all()
        self.after(100, self.update_loop)

if __name__ == "__main__":
    reader_thread = threading.Thread(target=serial_reader, daemon=True)
    reader_thread.start()
    app = SkyPlotApp()
    app.mainloop()
M5Stack GPS unit v1.1 は、多くの衛星を捕捉できます。
以上