Prometheusとは?
次世代監視ツールの大本命と呼ばれています。
Datadogっぽく使えるらしく、仕事でDatadogを使っているのでこれは良いと感じ導入することにしました。
参考文献
10分で理解する Prometheus
同僚Chanmoro氏の分かりやすい記事です。
nginx-prometheus-exporterをインストールする
Prometheusのインストール&起動
まず監視する側である、Prometheus本体を導入します。
Ubuntuの場合はaptやsnapのパッケージも存在しますが若干古めなので、公式のGetting Startedの手順通りにバイナリをインストールします。
https://prometheus.io/docs/prometheus/latest/getting_started/
まずこちらから最新のバイナリをダウンロードして設置します。
https://prometheus.io/download/
Linuxの場合は、たいたいOperating systemがLinux、Architectureはamd64だと思います。
wget https://github.com/prometheus/prometheus/releases/download/v2.20.1/prometheus-2.20.1.linux-amd64.tar.gz
tar xf prometheus-2.20.1.linux-amd64.tar.gz
mv prometheus-2.20.1.linux-amd64 prometheus
rm prometheus-2.20.1.linux-amd64.tar.gz
起動してみます。
cd prometheus
./prometheus
ブラウザでサーバーのポート9090を開くと管理画面の確認ができます。

nginx-prometheus-exporterの導入
次に監視される側にexporterを導入します。今回はnginxの死活監視をしたいので、公式が出しているnginx-prometheus-exporterをインストールします。
ngx_http_stub_status_moduleの有効化
まず最初に、nginxが標準で提供している、ngx_http_stub_status_moduleを有効化します。これはnginxの基本的なステータス情報を返すモジュールです。
モジュールが入っているか、一応確認してみます。
$ 2>&1 nginx -V | tr -- - '\n' | grep stub
http_stub_status_module
入っていました。aptでnginxを導入した場合は入っていると思います。
/etc/nginx/sites-enabled/defaultに以下を追加して有効化します。
server {
  location /stub_status {
    stub_status on;
  }
}
nginxをリロードし、curlでURLを叩いて以下のようなステータスが返ってくれば成功です。
$ curl localhost/stub_status
Active connections: 2
server accepts handled requests
 39 39 110
Reading: 0 Writing: 2 Waiting: 0
nginx-prometheus-exporterのインストールと起動
次に、nginx-prometheus-exporterをインストールします。公式を見るとdockerイメージもあるようですが、今回はバイナリで導入してみます。
wget https://github.com/nginxinc/nginx-prometheus-exporter/releases/download/v0.8.0/nginx-prometheus-exporter-0.8.0-linux-amd64.tar.gz
tar xf nginx-prometheus-exporter-0.8.0-linux-amd64.tar.gz
rm nginx-prometheus-exporter-0.8.0-linux-amd64.tar.gz
nginx-prometheus-exporterというバイナリファイルのみが展開されました。
次に、先程のstub URLに接続して起動します。-nginx.scrape-uriオプションでstub URLを指定します。
$ ./nginx-prometheus-exporter -nginx.scrape-uri http://localhost/stub_status

2020/08/09 10:59:10 Starting NGINX Prometheus Exporter Version=0.8.0 GitCommit=de15093
2020/08/09 10:59:10 Listening on :9113
2020/08/09 10:59:10 NGINX Prometheus Exporter has successfully started
9113番ポートで起動するようです。
Prometheusの監視対象にnginxを追加する
Prometheusを導入したディレクトリのprometheus.ymlの末尾あたりに以下を追記します。
  - job_name: nginx
    metrics_path: '/metrics'
    scheme: http

    static_configs:
      - targets: [
        'ホスト:9113'
      ]
Prometheusを再起動するとnginxが監視対象として追加されます。
とりあえずnginx_http_requests_totalを見てみます。
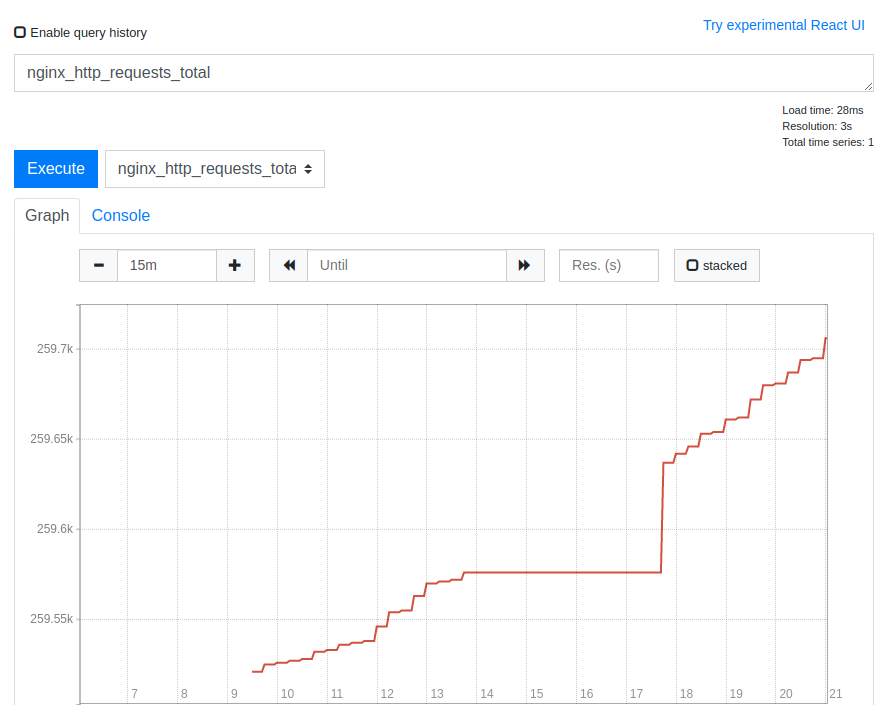
ちゃんと動いているっぽいですね。
死活監視ならnginx_upを見れば大丈夫かと思います。
終わりに
今回はここまでです。
今後は以下のようなことをやろうと思っています。
- Prometheus本体とnginx-prometheus-exporterのサービス化
- Prometheus本体には認証機構がないのでプロキシサーバーで認証する
- exporter_proxyを使ってexporterのポートを一元化する
- Grafanaでダッシュボードを作る
- アラートを飛ばす