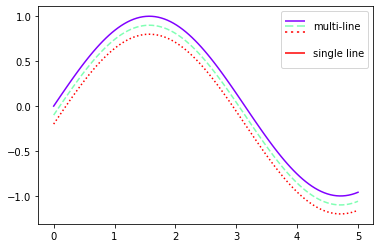
表題通りです.
まずは以下のようなコードを用います.
import matplotlib.pyplot as plt
import matplotlib.collections as mcol
from matplotlib.legend_handler import HandlerLineCollection
from matplotlib.lines import Line2D

import numpy as np


class HandlerMultipleLines(HandlerLineCollection):
    def _my_create_legline(self, idx, xdata, ydata, orig_handle, legend, trans):
        legline = Line2D(xdata, ydata)
        self.update_prop(legline, orig_handle, legend)
        try:
            color = orig_handle.get_colors()[idx]
        except IndexError:
            color = orig_handle.get_colors()[0]
        try:
            dashes = orig_handle.get_dashes()[idx]
        except IndexError:
            dashes = orig_handle.get_dashes()[0]
        try:
            lw = orig_handle.get_linewidths()[idx]
        except IndexError:
            lw = orig_handle.get_linewidths()[0]
        if dashes[1] is not None:
            legline.set_dashes(dashes[1])

        legline.set_color(color)
        legline.set_transform(trans)
        legline.set_linewidth(lw)
        return legline

    def create_artists(self, legend, orig_handle, xdescent, ydescent, width, height, fontsize, trans):
        n_lines = len(orig_handle.get_segments())
        xdata, _ = self.get_xdata(legend, xdescent, ydescent, width, height, fontsize)
        ydata = np.full_like(xdata, height / (n_lines + 1))
        kwargs = dict(xdata=xdata, orig_handle=orig_handle, legend=legend, trans=trans)
        leglines = [
            self._my_create_legline(idx=i, ydata=ydata * (n_lines - i) - ydescent, **kwargs)
            for i in range(n_lines)
        ]
        return leglines
実際に使用する方法は以下のとおりです.
x = np.linspace(0, 5, 100)

fig, ax = plt.subplots()
colors = [plt.get_cmap("rainbow")(i/2) for i in range(3)]
styles = ["solid", "dashed", "dotted"]
lines = []
for i, color, style in zip(range(3), colors, styles):
    ax.plot(x, np.sin(x) - .1 * i, c=color, ls=style)

# define invisible lines for legend entries
line = [[(0, 0)]]
lc1 = mcol.LineCollection(3 * line, linestyles=styles, colors=colors)
lc2 = mcol.LineCollection(line, linestyles=["solid"], colors=["red"])

# define a handler map to create legend entries
handler_map = {
    type(lc1): HandlerMultipleLines(),
    type(lc2): HandlerMultipleLines(),
}

# Set legend
ax.legend([lc1, lc2], ["multi-line", "single line"], handler_map=handler_map, handleheight=3)

plt.show()
出力結果
余談ですが,markerは現状対応していないようです.
