opensourceのheatrapyを使用して一次元非定常伝熱解析をやってみました。
最近、仕事で熱関係をやっています。
環境構築
pip install heatrapy
やれること
以下の事が出来ます。かなり色々できますね!
- 非定常
- 材料の温度依存性
- 材料を任意で追加可能
- コンポーネント間の接触
- 境界条件は、温度指定か断熱条件
- 任意の位置での系外への熱移動(入熱、出熱)← 熱伝達率や輻射での熱の出入りを設定可能
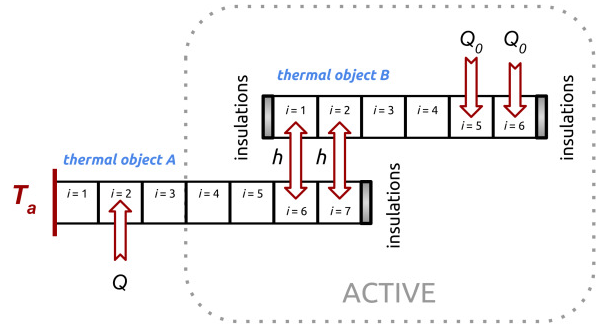
####【モデル】
- Ta,insulations :境界条件
- Q : 熱の授受(任意の位置で可能)
- h : 接触条件(任意の位置で可能)
- Q0 : 温度に依存する熱の授受(任意の位置で可能)
論文
理論的なものは下記論文にまとまってます。ありがたや
https://www.sciencedirect.com/science/article/pii/S2352711018301298#!
1コンポーネントの一次元非定常熱解析
ドキュメントにある例です。
【解析条件】
- コンポーネントの長さ:0.5m
- 材料(materials):Gd(ガドリニウム)
- 初期条件(amb_temperature):293K
- 境界条件(boundaries):左側は温度条件(300K)で、右側は断熱(0で断熱条件)
- 時間ステップ(dt):1秒(ここの設定を間違うと、変になるので注意!←伝熱速度の関係です)
- 分割数(borders):10分割
- 空間ステップ(dx):0.05m(コンポーネント長さ/分割数 = 0.5/10 = 0.05m)
- 時間(timeInterval):30000s
【材料】
材料データは、インストールフォルダ/heatrapy/database の中にあります。ここに追加していけば、材料の追加が可能です。
材料フォルダ内の各ファイル名は、下記の物性値を意味しており、値は温度依存を入れる事ができます。
- cp:比熱[J/kg ℃]
- k:熱伝導率[W/m K]
- rho:密度[kg/m3]
####【実行】
ドキュメントのまま、動かそうとしても動きません。。。(メンテしてないのだろうなぁ)
そこで、ソースコードを見て、修正しました。
下記コードを実行すると、example.txtに解析結果が出力されます。write_intervalは何秒毎に結果を出力するかの指定です。
solverは4つ用意されていて、適宜選択するようです。
import heatrapy as ht

example = ht.single_object(amb_temperature=293, materials=('Gd',), borders=(1,11),materials_order=(0,),
                            dx=0.05, dt=1., file_name='example.txt',boundaries=(300,0), Q=[], Q0=[],initial_state=False)

example.compute(timeInterval=30000, write_interval=300, solver='implicit_k(x)')
####【結果の可視化】
ドキュメントには、physplotlibで結果を見るとありますが、pandasを使って結果を見ていきます。
df = pd.read_csv("example.txt")
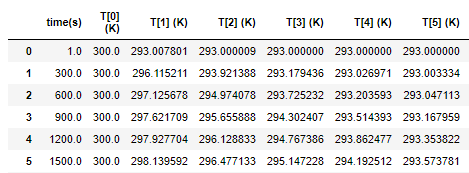
上記で出力ファイルを読み込みます。下記のように、各節点での温度が時刻歴で出力されます。
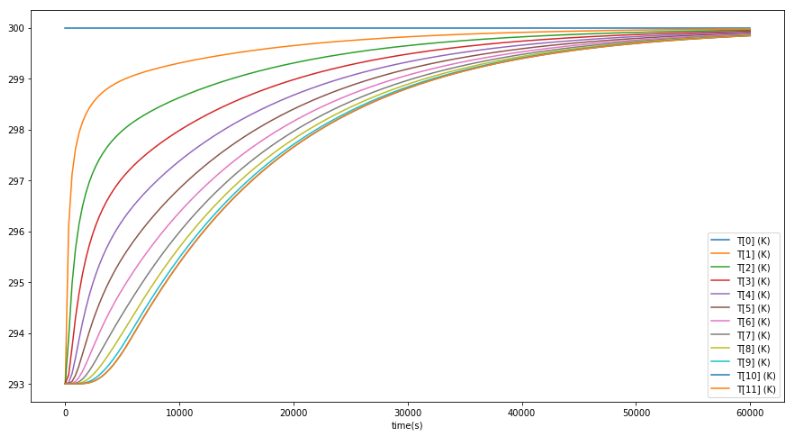
グラフで見てみましょう
df = pd.read_csv("example.txt")
df=df.drop("heat[1](W)", axis=1)
df=df.drop("heat[-2](J)", axis=1)
df = df.set_index("time(s)")
df.plot(figsize=(15,8))
ザ、一次元非定常熱解析のグラフですね!
感想
なかなかに素晴らしいライブラリです。論文にもあるように、熱解析とオブジェクト指向プログラムは大変相性がよいです!
こういうライブラリが増えてくれると、製造業でも”車輪の再発明”しなくて済むのですが、それは未だ先の話。


