続きを3年後に書くとは……
三年前にBlenderのPython コンソールに触り、3年ぶりに触る機会がでてきたので、続きを書いていきたいと思います。
Blenderのバージョン
Blender2.8.1a:大幅なUIとAPIの変更があったみたいです。
Blender上のデバック環境
以下のような配置にしました。
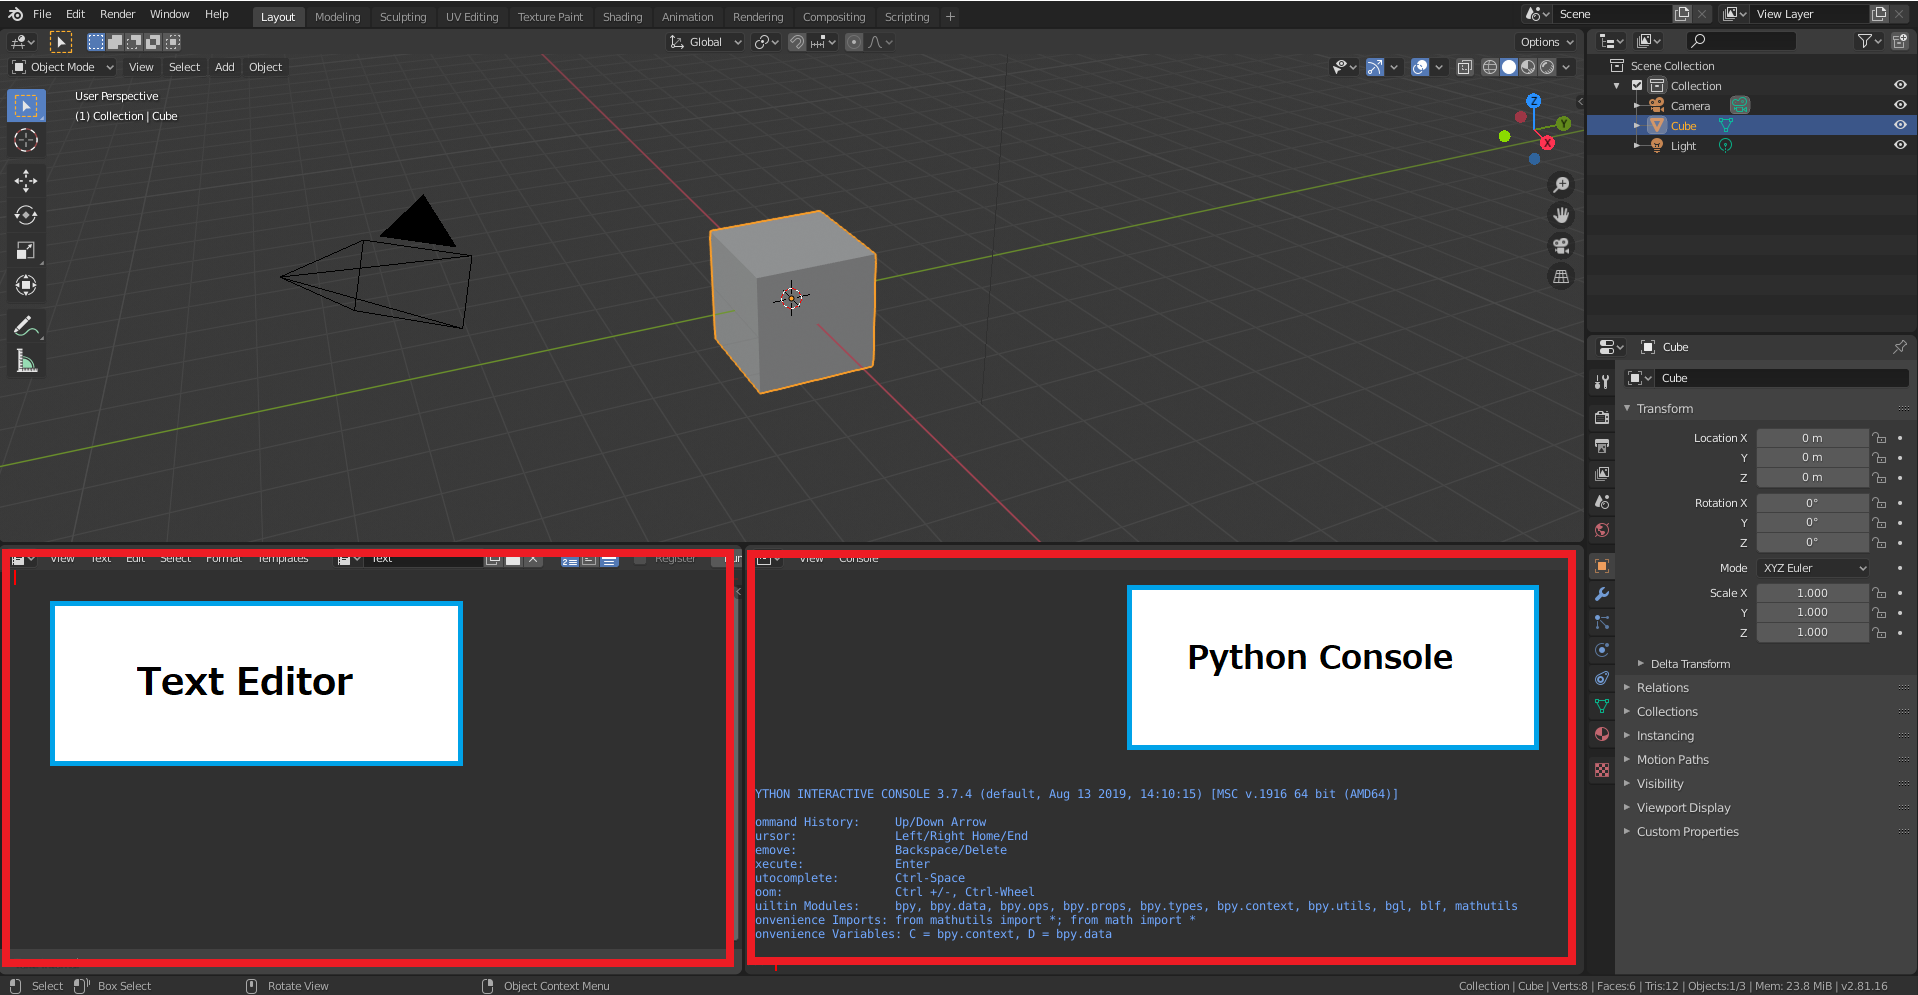
図の表示の左下に Text Editor 右下に Python Editor を配置しました.
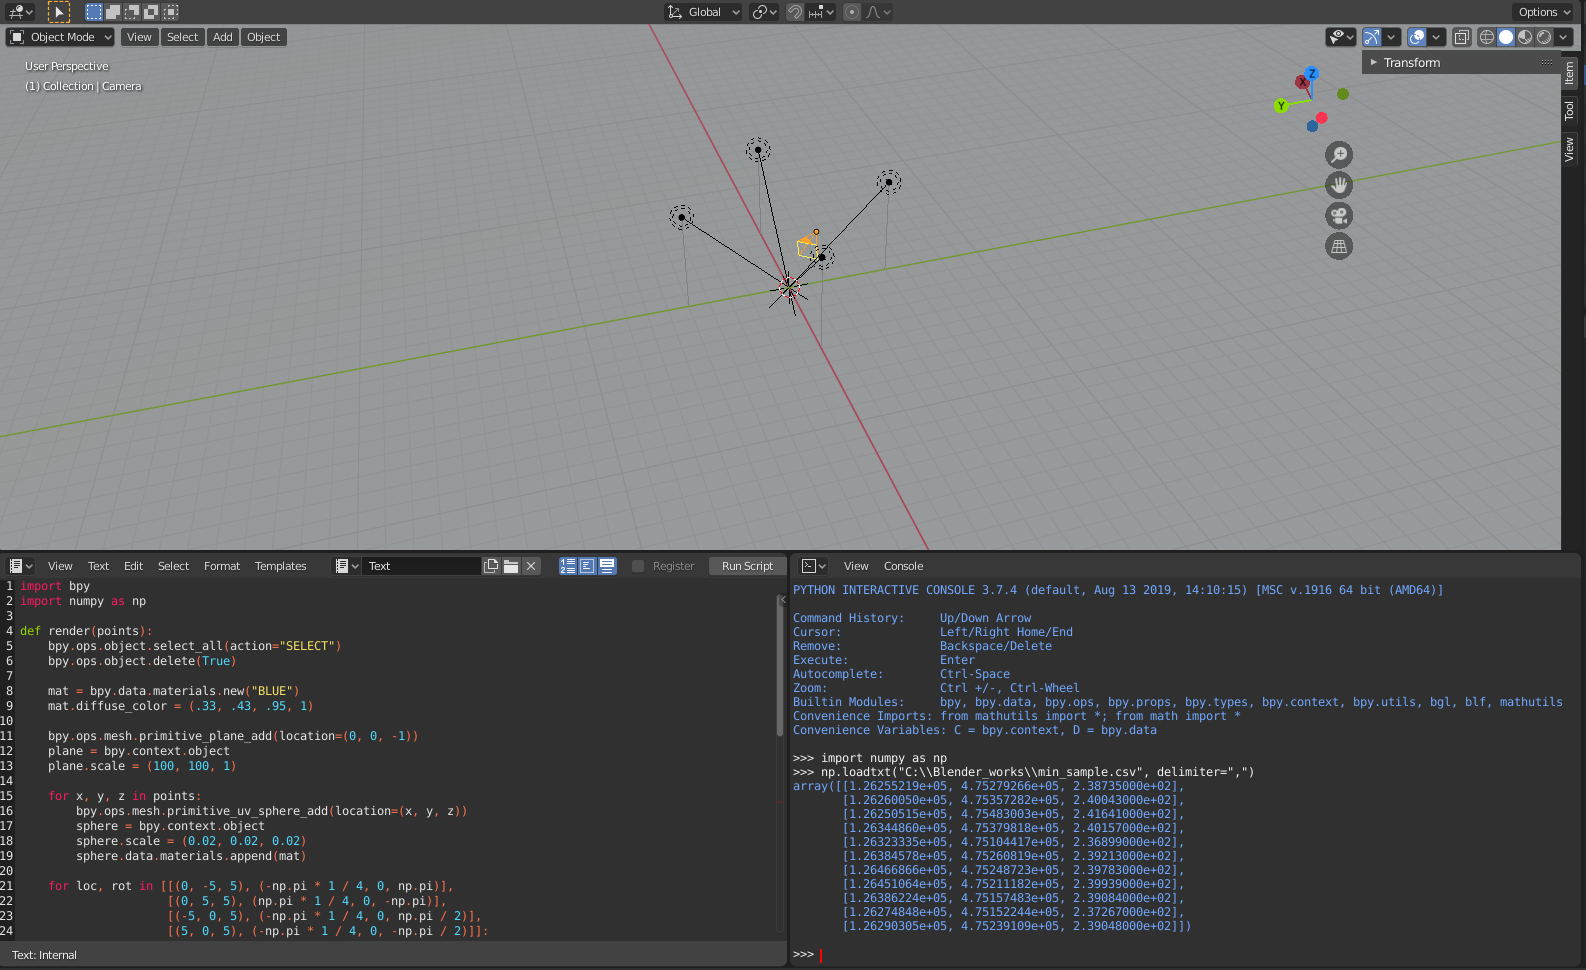
最低限の点データを表示してみる.
スクリプトは、参考のBlender + Pythonでポイントクラウドを可視化する記事を参考にしました。
import bpy
import numpy as np

def render(points):
    bpy.ops.object.select_all(action="SELECT")
    bpy.ops.object.delete(True)

    mat = bpy.data.materials.new("BLUE")
    mat.diffuse_color = (.33, .43, .95, 1)

    bpy.ops.mesh.primitive_plane_add(location=(0, 0, -1))
    plane = bpy.context.object
    plane.scale = (100, 100, 1)

    for x, y, z in points:
        bpy.ops.mesh.primitive_uv_sphere_add(location=(x, y, z))
        sphere = bpy.context.object
        sphere.scale = (0.02, 0.02, 0.02)
        sphere.data.materials.append(mat)

    for loc, rot in [[(0, -5, 5), (-np.pi * 1 / 4, 0, np.pi)],
                     [(0, 5, 5), (np.pi * 1 / 4, 0, -np.pi)],
                     [(-5, 0, 5), (-np.pi * 1 / 4, 0, np.pi / 2)],
                     [(5, 0, 5), (-np.pi * 1 / 4, 0, -np.pi / 2)]]:
        light_data = bpy.data.lights.new(name="light", type="AREA")
        light_data.energy = 500
        light_object = bpy.data.objects.new(name="light", object_data=light_data)
        bpy.context.collection.objects.link(light_object)
        bpy.context.view_layer.objects.active = light_object
        light_object.location = loc
        light_object.rotation_euler = rot

    bpy.ops.object.camera_add(location=(3.25, -2.48, 0.745))
    camera_rotations = (np.pi * 78 / 180, 0, 52.5 * np.pi / 180)
    bpy.data.objects["Camera"].rotation_euler = camera_rotations

    bpy.context.scene.render.resolution_x = 500
    bpy.context.scene.render.resolution_y = 500
    bpy.context.scene.render.resolution_percentage = 100
    bpy.context.scene.camera = bpy.context.object
    # bpy.context.scene.render.image_settings.file_format = "PNG"
    bpy.ops.render.render(write_still=True)

if __name__ == "__main__":
    points = np.loadtxt("C:\\Blender_works\\min_sample.csv", delimiter=",")
    render(points)
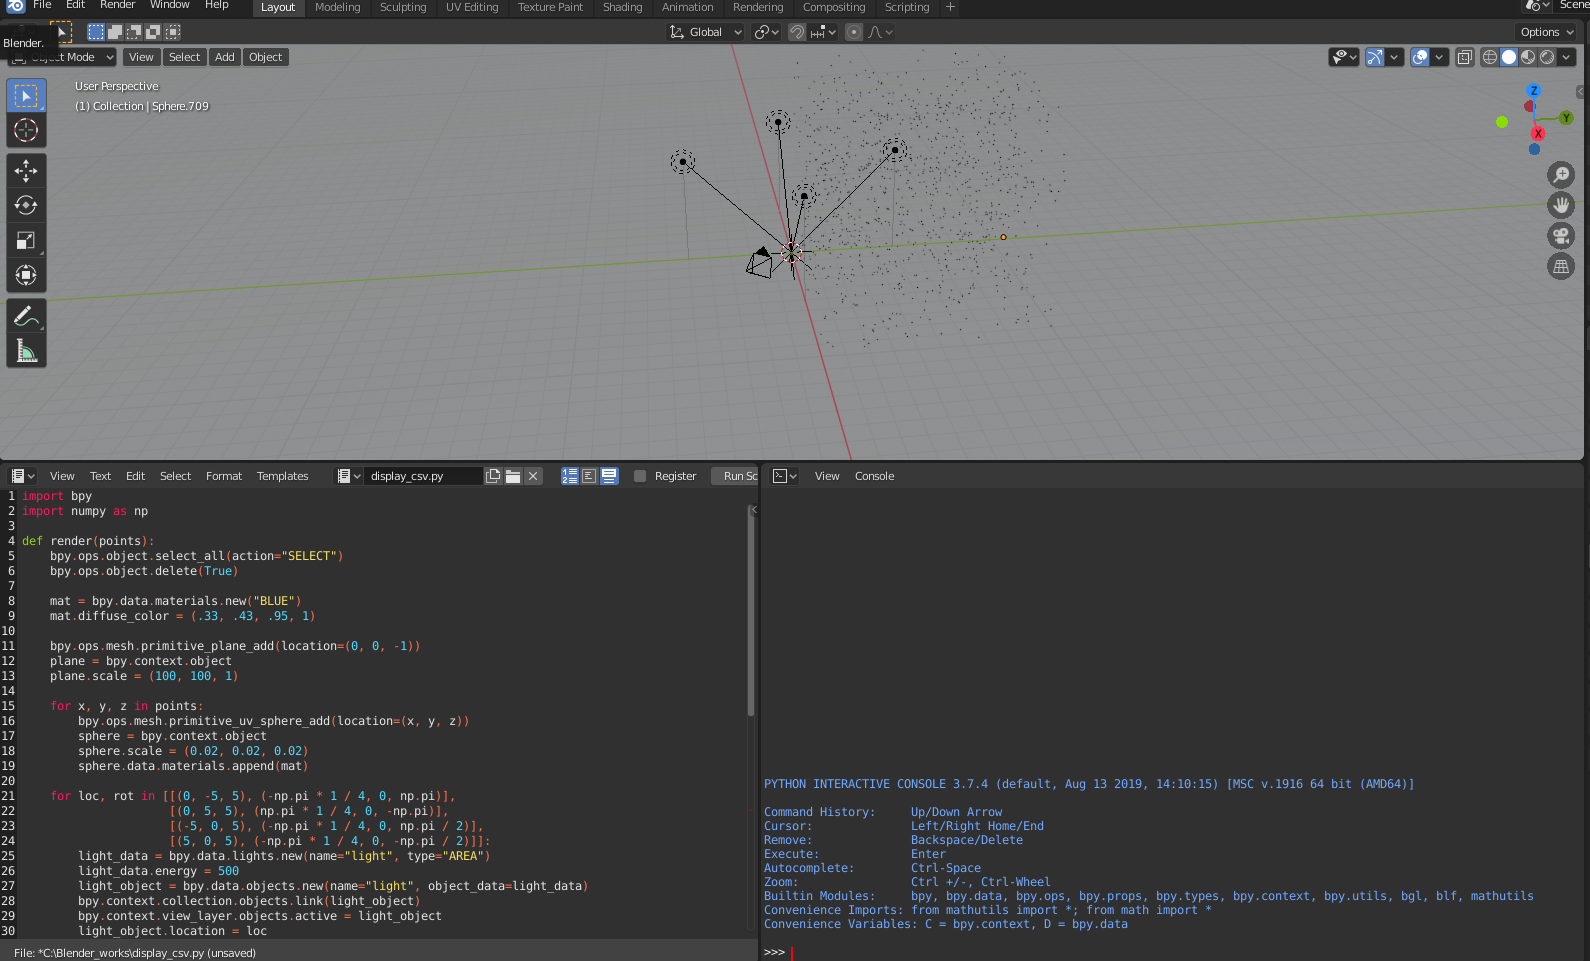
1000件程度のデータを可視化してみる.
データ作成スクリプト
import numpy as np
import pandas as pd
N = 1000
df =pd.DataFrame({
    "x": np.random.uniform(0.0, 10., N),
    "y": np.random.uniform(0.0, 10., N),
    "z": np.random.uniform(0.0, 10., N)
})
df.to_csv("./random_data.csv", header=False, index=False)
次回は
Jupyter notebookの連携などを調べていこうと思います。