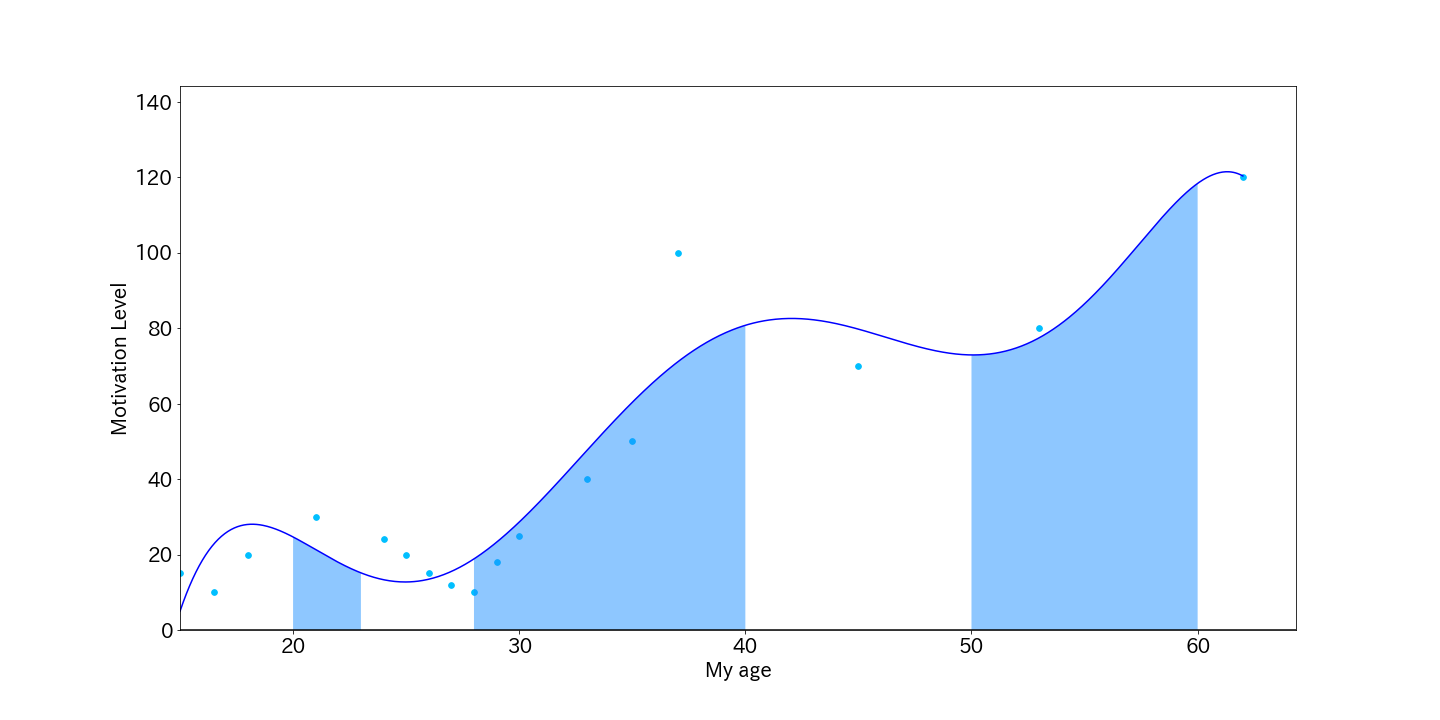
タイトル通りです.
人生曲線とは,これまでの自分の経験を時系列で振り返り,
x軸を年齢,y軸をモチベーション(幸福度,充実度)として,プロットしたものです.
次に,y軸が高くなっていくところ,低くなっていくところ,に着目し,
なぜそのようになったのかを繰り返すことで,自分の本質的な価値観が分かる,という仕掛けです.
記載のコードの使い方は,自分の経験に合わせて,x, y のデータを改変し,
「ああ,そうそうこんな感じ」というようなグラフが出力される次数を探します.
lifeCurve
import numpy as np
import matplotlib.pyplot as plt

x = np.array([15.0, 16.5, 18.0, 21, 24.0, 25, 26, 27, 28, 29, 30, 33, 35, 37, 45, 53, 62])
y = np.array([15.0, 10.0, 20.0, 30, 24.0, 20, 15, 12, 10, 18, 25, 40, 50, 100, 70, 80, 120])
xp = np.linspace(min(x), max(x), 1000)

plt.rcParams["font.size"] = 20
fx = np.poly1d(np.polyfit(x, y, 6)) # ← 次数はいま6.ここを調整.
fig, ax = plt.subplots(figsize=(20,10))
ax.plot(xp, fx(xp), '-', color='blue')
ax.scatter(x, y, color='deepskyblue', s=32)
ax.axhline([0], color='black')
ax.set_xlim(min(x), None)
ax.set_ylim(0, 1.2*max(y))
ax.set_ylabel('Motivation Level')
ax.set_xlabel('My age')

color = '#1e90ff'
p1 = np.linspace(20, 23)
ax.fill_between(p1, fx(p1), 0, facecolor=color, alpha=0.5)
p2 = np.linspace(28, 40)
ax.fill_between(p2, fx(p2), 0, facecolor=color, alpha=0.5)
p3 = np.linspace(50, 60)
ax.fill_between(p3, fx(p3), 0, facecolor=color, alpha=0.5)
fig.savefig('./data/img/lifeCurve.png'))
