目的
ポリアクリルアミド電気泳動(SDS-PAGE)はタンパク質を分子量で分離することができ、液中のタンパク質の分布を半定量的に確認できます。生命科学では多用され、私自身も多く活用しています。しかし、その解析は泳動後のゲルを視覚的に観察するか、目的のバンドに対してimage J等で濃度を換算し、相対的に定量するようなことしかしておりませんでした。
今回は、複数のSDS-PAGEのゲルに対して、汎用的な方法でレーン毎を比較できるような手法を開発することを目的としました。具体的なゴールはまだできていませんが、同じようなことをしている方や誰かの参考になれば幸いです。
方法
まだsmilingやsmearingに対してはあまり対処しておりませんが、大きく分けると
画像からレーンを切り取る
↓
レーンからクロマトグラムを作成する
↓
バックグラウンドを除去する
↓
タンパク質スタンダードラダーのレーンから分子量の検量線を作成する
↓
各クロマトグラムに多変量正規分布の当てはめを行う
↓
一つの正規分布が一つのバンドとみなし、面積を定量
↓
正規分布の位置を検量線によって分子量に変換
↓
バンドの分子量と濃度が算出できる
となっています。ここからさらに同一高さのバンドを同じものとみなしたりしたかったのですが、まだアイデアが湧いていません。良い意見があれば是非お願いいたします。
本記事では太字になっている部分までの流れを記載します。
後半については別記事で説明します。
画像からレーンを切り取る
の前にとりあえず画像ファイルをnumpy array形式で読み込みます。
import gdal
from PIL import Image
import numpy as np
import matplotlib.pyplot as plt
import matplotlib


def get_img(path,ftype="tif"):
  if ftype == "tif":
    array = gdal.Open(path).ReadAsArray()
    img = array[0]
  elif ftype in ["jpg","png"]:
    img = np.array(Image.open(path).convert("L"))

  plt.imshow(img,cmap="gray")
  plt.show()
  return img
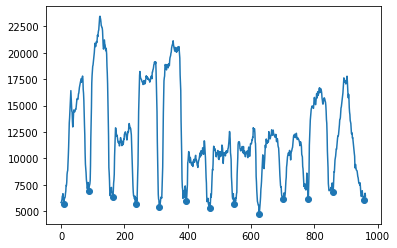
編集の都合上、画像の白黒を反転し、画像を泳動方向にすべて足し合わせます。すると、レーンとレーンの間が何も泳動されていないため値が低くなり、逆にバンドが存在するレーンは値が高くなることで、極小値でレーン間を分離できるようになります。
ただし、極小値を見つけるときはscipy.signalのargrelminを使用するのですが、その引数orderによって極小値の見つかりやすさが異なります。なので、指定したレーン数(n)分の極小値が見つかるまでorderの値を大きくしていきます。
img=255-img

tate = img.sum(axis=0)

for i in range(1,100,2):
  minid = signal.argrelmin(tate, order=i)[0]
if len(minid) == n-1:break

plt.plot(tate)
plt.scatter(minid,tate[minid])
plt.show()

このとき、ノイズ等によってレーン端が分離してしまったり、分離できなかったりするので、その場合はレーン数よりも多い n で分離し、余計に分離された部分については後の計算で無視します。
レーンからクロマトグラムを作成する
その後、得られた極小値の位置で、画像をレーン毎の画像に分離します。分離したレーンは今度は泳動方向に対して垂直に足し合わせて、クロマトグラムを作成します。このとき画像が回転していたり、smilingが起きているとノイズの原因となります。
if minid[0] != 0:
  minid = np.append(0, minid)

if minid[-1] != tate.shape[0]:
  minid = np.append(minid, tate.shape[0])

lanes = []
lane_imgs =[]
i_b = 0
for i in minid[1:]:
  lane_imgs.append(img[:,i_b:i])
  lanes.append(img[:,i_b:i].sum(axis=1))
  i_b = i


COL = n//3
ROW = 4

plt.figure(figsize=(6*COL,2*ROW))

for i,img in enumerate(lane_imgs):
  plt.subplot(ROW,COL,i+1)
  plt.imshow(img.T*(-1),cmap="gray")
plt.show()


plt.figure(figsize=(6*COL,4*ROW))

for i,lane in enumerate(lanes):
  plt.subplot(ROW,COL,i+1)
  plt.plot(lane)
plt.show()
バックグラウンドを除去する
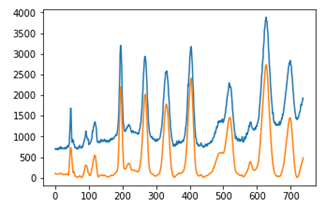
このままではバックグラウンドが乗っていて定量に向きません。なのでバックグラウンド消去を行います。
手法については「スペクトルデータを平滑化とベースライン推定できれいにする方法」を参考に(というか丸パクリ)させていただきました。詳細な記事ありがとうございます。
from scipy.sparse import csc_matrix, spdiags
import scipy.sparse.linalg as spla
import scipy.interpolate as scipl

#パラメタを入力します、うまく推定ができないときはここをいじってください
#AsLSでのベースライン推定は ( W(p) + lam*D'D )z = Wy のとき、重み p と罰則項の係数 lam がパラメタです
#Savitzky-Golyでは、測定値をいくつに分割するかを dn で設定し(窓の数は len(Y)/dn になります)、多項式次数を poly で設定します
# paramAsLS = [ lam , p ]
# paramSG   = [ dn , poly ]
paramAsLS = [10**3.5, 0.00005]
paramSG = [40, 5]


#AsLSによりベースライン推定を行います
def baseline_als(y, lam, p, niter=10):
    #https://stackoverflow.com/questions/29156532/python-baseline-correction-library
    #p: 0.001 - 0.1, lam: 10^2 - 10^9
    # Baseline correction with asymmetric least squares smoothing, P. Eilers, 2005
    L = len(y)
    D = csc_matrix(np.diff(np.eye(L), 2))
    w = np.ones(L)
    for i in range(niter):
        W = spdiags(w, 0, L, L)
        Z = W + lam * D.dot(D.transpose())
        z = spla.spsolve(Z, w*y)
        w = p * (y > z) + (1-p) * (y < z)
    return z

#Savitzky-Golyによりノイズ除去を行います
def SGs(y,dn,poly):
    # y as np.array, dn as int, poly as int
    n = len(y) // dn
    if n % 2 == 0:
        N = n+1
    elif n % 2 == 1:
        N = n
    else:
        print("window length can't set as odd")
    SGsmoothed = signal.savgol_filter(y, window_length=N, polyorder=poly)
    return SGsmoothed

def correct_baseline(y):
  bkg = baseline_als(y,paramAsLS[0], paramAsLS[1])
  fix = y - bkg
  smth= SGs(fix, paramSG[0], paramSG[1])
  return smth
この correct_baseline をすべてのレーンに適用します。
def correct_baselines(lanes):
  lanes_c = []

  for i,lane in enumerate(lanes):
    lanes_c.append(correct_baseline(lane))
  return lanes_c

見事にベースラインが落ちて、きれいになりました。軽くスムージングもかかっており解析しやすそうです。
タンパク質スタンダードラダーのレーンから分子量の検量線を作成する
タンパク質スタンダードラダーは同じ条件であれば同じように泳動されてはくれますが、微妙に幅が異なったりしています。ここの補正を気持ち程度でも出来るように分子量の検量線を作成します。
切り取ったレーンのうちスタンダードラダーのレーンをcontrolとします。
control = lanes_c[control_n]
control_img = lane_imgs[control_n]
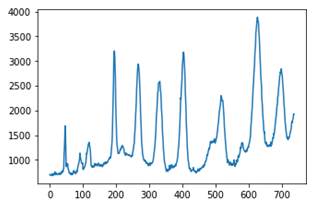
今度はバンド位置を決定するために極大値の点を見つけます。先ほどと同様の方法を使って今度はargrelmaxで行います。同様にノイズ等でピークが見つからない場合があるので、その場合はバンド数よりも多い p で分離し、余計に検出された部分については後の計算で無視します。
def get_control_peak(control,img,p=12):
  for i in range(10,100,2):
    minid = signal.argrelmax(control, order=i)[0]
    if len(minid) <= p:break

  plt.plot(control)
  plt.scatter(minid,control[minid])
  plt.show()

  plt.imshow(img.T*(-1),cmap="gray")
  plt.show()
  return minid

mw = get_control_peak(control,control_img,p=p)

今回であればどうしても見つけられないピーク(右から4つめのピークの肩)といくつかのノイズがありました。
これは次の検量線を作成する際に無視します。
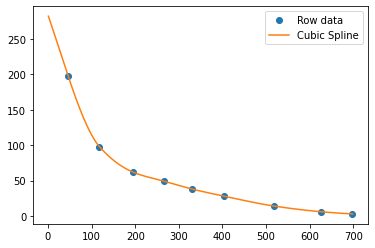
検量線はスプライン補完で作成します。
予め、先ほどの検出されたピークに当たる分子量をリストとして用意します。ただし、余計に検出されたピークについては0を代入しておきます。
ladders = [0,198,0,98,0,62,0,49,38,28,14,0,6,3]

def control_spline(ladders,mw):
  id = [mw[i] for i in range(len(mw)) if ladders[i] !=0]
  mw = [ladders[i] for i in range(len(ladders)) if ladders[i] !=0]

  #補間式
  x=np.arange(1,700,1)
  #f=scipl.CubicSpline(id,mw)  #スプライン補間
  f=scipl.PchipInterpolator(id, mw)
  pred= f(x)

  #グラフ出力
  plt.plot(id, mw,'o')
  plt.plot(x, f(x),'-')
  plt.legend(['Row data','Cubic Spline'])
  plt.show()

  return f(x).reshape(-1)
作成した検量線において、小さすぎる分子量の部分と大きすぎる分子量の部分は削ります。
加えてずっと画像の値を使っていましたが、クロマトグラム全体を1とした確率密度分布に変換します。これによって総蛋白量が1とした割合が計算できるようになりました。仮にスタンダードラダーのタンパク量が既知であれば概算のタンパク量も計算可能であるはずです。
def mw_cut(x2,lanes_c,mwmin=5,mwmax=350):
  mw_min = np.argmin(x2>mwmin)
  mw_max = np.argmax(x2>mwmax)

  print(mw_min,mw_max)

  if mw_min>len(lanes_c[0]):
    mw_min = len(lanes_c[0])
  if not mw_max:
    mw_max=0

  print(mw_min,mw_max)

  lanes_c_s = []

  for lane in lanes_c:
    l = lane[mw_max:mw_min]
    s = sum(lane[mw_max:mw_min])
    lanes_c_s.append(l/s)
  return x2[mw_max:mw_min],lanes_c_s
この検量線から"ずれ"を排除したクロマトグラムを作成する方法についてはいろいろと考えたのですが、"ずれ"程度なので、ずらすだけにしました。分子量が線形増加になるように変換することも考えたのですが、間延びして逆にわかりずらくなり保留としました。
方法としてはあらかじめ用意した元の式にプロットしなおします。この式は別データでlog(x/a)/log(b)でフィッティングしたものです。
これにより他のゲルで泳動したレーンについても同じx軸で比較できるようになります。
xfunc = (lambda x:np.log(x/401)/np.log(0.992),lambda x:401*0.992**x)


plt.figure(figsize=(6*COL,2*ROW))

scale = [i for i in [10,20,40,60,80,120,180,240,320] if i>mwmin and i<mwmax]

for i,lane in enumerate(lanes_c_s):
    ax = plt.subplot(ROW,COL,i+1)
    ax.plot(x2_s,lane)
    ax.set_xscale("function",functions=xfunc)
    ax.set_xlim(mwmin,mwmax)
    ax.invert_xaxis()
    #ax.set_ylim(None,0.04)
    ax.set_xticks(scale)
    ax.get_xaxis().set_major_formatter(matplotlib.ticker.ScalarFormatter())

plt.show()
まとめ
import matplotlib.pyplot as plt
import gdal
from scipy import signal,optimize
import numpy as np

import matplotlib
from PIL import Image

def get_img(path,ftype="tif"):
  if ftype == "tif":
    array = gdal.Open(path).ReadAsArray()
    img = array[0]
  elif ftype in ["jpg","png"]:
    img = np.array(Image.open(path).convert("L"))

  plt.imshow(img,cmap="gray")
  plt.show()
  return img

def lane_cutting(img,n):

  img=255-img

  tate = img.sum(axis=0)


  for i in range(1,100,2):
    minid = signal.argrelmin(tate, order=i)[0]
    if len(minid) == n-1:break

  plt.plot(tate)
  plt.scatter(minid,tate[minid])
  plt.show()


  plt.imshow(img,cmap="gray")

  for x in minid:
    plt.vlines(x,0,600,"r")
  plt.show()

  if minid[0] != 0:
    minid = np.append(0, minid)

  if minid[-1] != tate.shape[0]:
    minid = np.append(minid, tate.shape[0])

  lanes = []
  lane_imgs =[]
  i_b = 0
  for i in minid[1:]:
    lane_imgs.append(img[:,i_b:i])
    lanes.append(img[:,i_b:i].sum(axis=1))
    i_b = i

  COL = n//3
  ROW = 4


  plt.figure(figsize=(6*COL,4*ROW))

  for i,lane in enumerate(lanes):
    plt.subplot(ROW,COL,i+1)
    plt.plot(lane)
  plt.show()

  plt.figure(figsize=(6*COL,2*ROW))

  for i,img in enumerate(lane_imgs):
    plt.subplot(ROW,COL,i+1)
    plt.imshow(img.T*(-1),cmap="gray")
  plt.show()

  return lanes,lane_imgs

import numpy as np
from scipy import signal
from scipy.sparse import csc_matrix, spdiags
import scipy.sparse.linalg as spla
import scipy.interpolate as scipl

#パラメタを入力します、うまく推定ができないときはここをいじってください
#AsLSでのベースライン推定は ( W(p) + lam*D'D )z = Wy のとき、重み p と罰則項の係数 lam がパラメタです
#Savitzky-Golyでは、測定値をいくつに分割するかを dn で設定し(窓の数は len(Y)/dn になります)、多項式次数を poly で設定します
# paramAsLS = [ lam , p ]
# paramSG   = [ dn , poly ]
paramAsLS = [10**3.5, 0.00005]
paramSG = [40, 5]


#AsLSによりベースライン推定を行います
def baseline_als(y, lam, p, niter=10):
    #https://stackoverflow.com/questions/29156532/python-baseline-correction-library
    #p: 0.001 - 0.1, lam: 10^2 - 10^9
    # Baseline correction with asymmetric least squares smoothing, P. Eilers, 2005
    L = len(y)
    D = csc_matrix(np.diff(np.eye(L), 2))
    w = np.ones(L)
    for i in range(niter):
        W = spdiags(w, 0, L, L)
        Z = W + lam * D.dot(D.transpose())
        z = spla.spsolve(Z, w*y)
        w = p * (y > z) + (1-p) * (y < z)
    return z

#Savitzky-Golyによりノイズ除去を行います
def SGs(y,dn,poly):
    # y as np.array, dn as int, poly as int
    n = len(y) // dn
    if n % 2 == 0:
        N = n+1
    elif n % 2 == 1:
        N = n
    else:
        print("window length can't set as odd")
    SGsmoothed = signal.savgol_filter(y, window_length=N, polyorder=poly)
    return SGsmoothed

def correct_baseline(y):
  bkg = baseline_als(y,paramAsLS[0], paramAsLS[1])
  fix = y - bkg
  smth= SGs(fix, paramSG[0], paramSG[1])
  return smth

def correct_baselines(lanes):
  lanes_c = []

  for i,lane in enumerate(lanes):
    lanes_c.append(correct_baseline(lane))
  return lanes_c

def get_control_peak(control,img,p=12):
  for i in range(10,100,2):
    minid = signal.argrelmax(control, order=i)[0]
    if len(minid) <= p:break

  plt.plot(control)
  plt.scatter(minid,control[minid])
  plt.show()

  plt.imshow(img.T*(-1),cmap="gray")
  plt.show()
  return minid

def control_spline(ladders,mw):
  id = [mw[i] for i in range(len(mw)) if ladders[i] !=0]
  mw = [ladders[i] for i in range(len(ladders)) if ladders[i] !=0]

  #補間式
  x=np.arange(1,700,1)
  #f=scipl.CubicSpline(id,mw)  #スプライン補間
  f=scipl.PchipInterpolator(id, mw)
  pred= f(x)

  #グラフ出力
  plt.plot(id, mw,'o')
  plt.plot(x, f(x),'-')
  plt.legend(['Row data','Cubic Spline'])
  plt.show()

  return f(x).reshape(-1)


def mw_cut(x2,lanes_c,mwmin=5,mwmax=350):
  mw_min = np.argmin(x2>mwmin)
  mw_max = np.argmax(x2>mwmax)

  print(mw_min,mw_max)

  if mw_min>len(lanes_c[0]):
    mw_min = len(lanes_c[0])
  if not mw_max:
    mw_max=0

  print(mw_min,mw_max)

  lanes_c_s = []

  for lane in lanes_c:
    l = lane[mw_max:mw_min]
    s = sum(lane[mw_max:mw_min])
    lanes_c_s.append(l/s)


  return x2[mw_max:mw_min],lanes_c_s

xfunc = (lambda x:np.log(x/401)/np.log(0.992),
          lambda x:401*0.992**x)

def img2standard_lane(path,ftype="tif",n=12,control_n=0,peak=13,skip_lane=[]):

  COL = n//3
  ROW = 4

  img = get_img(path,ftype)

  lanes,lane_imgs = lane_cutting(img,n=n)

  if len(skip_lane):
    lanes = [lanes[i] for i in range(len(lanes)) if i not in skip_lane]
    lane_imgs = [lane_imgs[i] for i in range(len(lane_imgs)) if i not in skip_lane]

  lanes_c = correct_baselines(lanes)


  plt.figure(figsize=(6*COL,4*ROW))

  for i,(lane1,lane2) in enumerate(zip(lanes,lanes_c)):
    plt.subplot(ROW,COL,i+1)
    plt.plot(lane1)
    plt.plot(lane2)

  plt.show()

  plt.figure(figsize=(6*COL,2*ROW))

  for i,img in enumerate(lane_imgs):
    plt.subplot(ROW,COL,i+1)
    plt.imshow(img.T*(-1),cmap="gray")

  plt.show()


  control = lanes_c[control_n]
  control_img = lane_imgs[control_n]

  mw = get_control_peak(control,control_img,p=peak)
  return lanes_c,lane_imgs,mw


def lane2mwstandard(lanes_c,mw,ladders,mwmin=5,mwmax=350):
  COL = len(lanes_c)//3
  ROW = 4

  x2 = control_spline(ladders,mw)

  x2_s,lanes_c_s = mw_cut(x2,lanes_c,mwmin,mwmax)

  plt.figure(figsize=(6*COL,2*ROW))

  scale = [i for i in [10,20,40,60,80,120,180,240,320] if i>mwmin and i<mwmax]

  for i,lane in enumerate(lanes_c_s):
    ax = plt.subplot(ROW,COL,i+1)
    ax.plot(x2_s,lane)
    ax.set_xscale("function",functions=xfunc)
    ax.set_xlim(mwmin,mwmax)
    ax.invert_xaxis()
    #ax.set_ylim(None,0.04)
    ax.set_xticks(scale)
    ax.get_xaxis().set_major_formatter(matplotlib.ticker.ScalarFormatter())

  return x2_s,lanes_c_s
lanes_c,lane_imgs,mw = img2standard_lane(path,"jpg",n=14,peak=15,skip_lane=[0,12,13])
ladders = [0,198,0,98,0,62,0,49,38,28,14,0,6,3]

ladder, lanes = lane2mwstandard(lanes_c,mw,ladders)
参考文献
- スペクトルデータを平滑化とベースライン推定できれいにする方法(https://qiita.com/lcmtk/items/06bdd965d8a79bbfd0a9)


