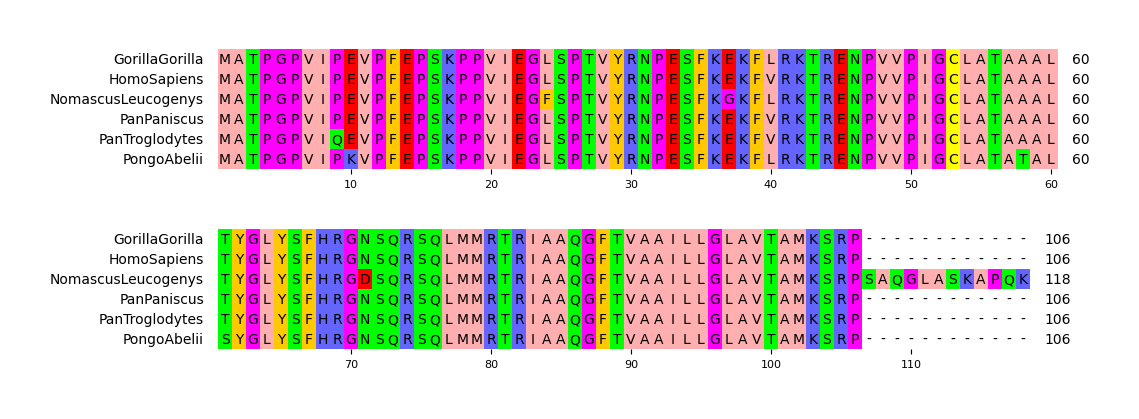
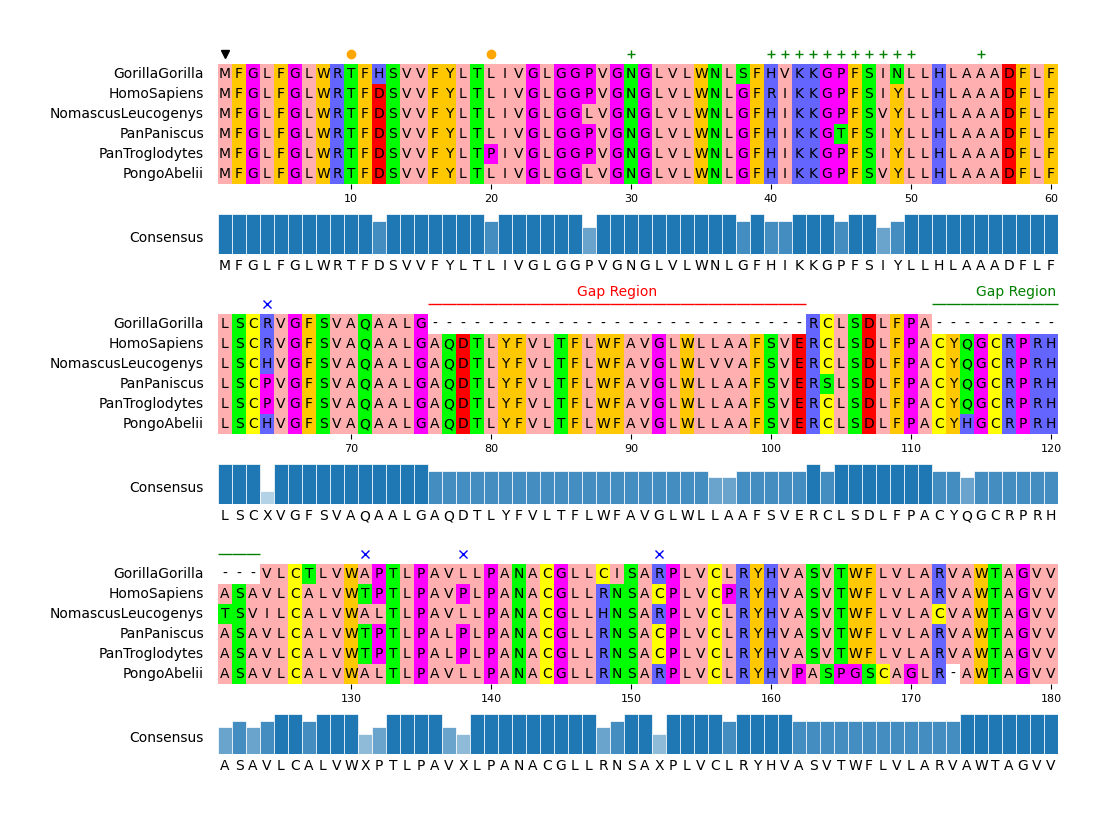
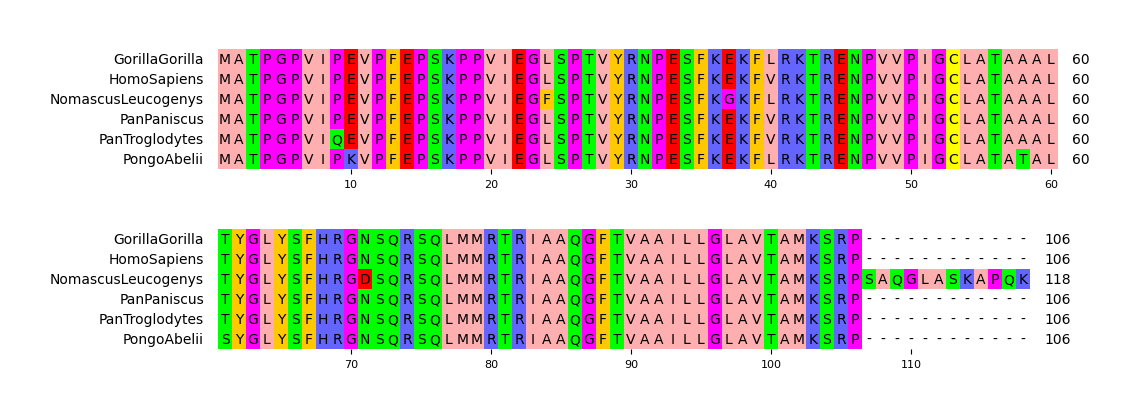
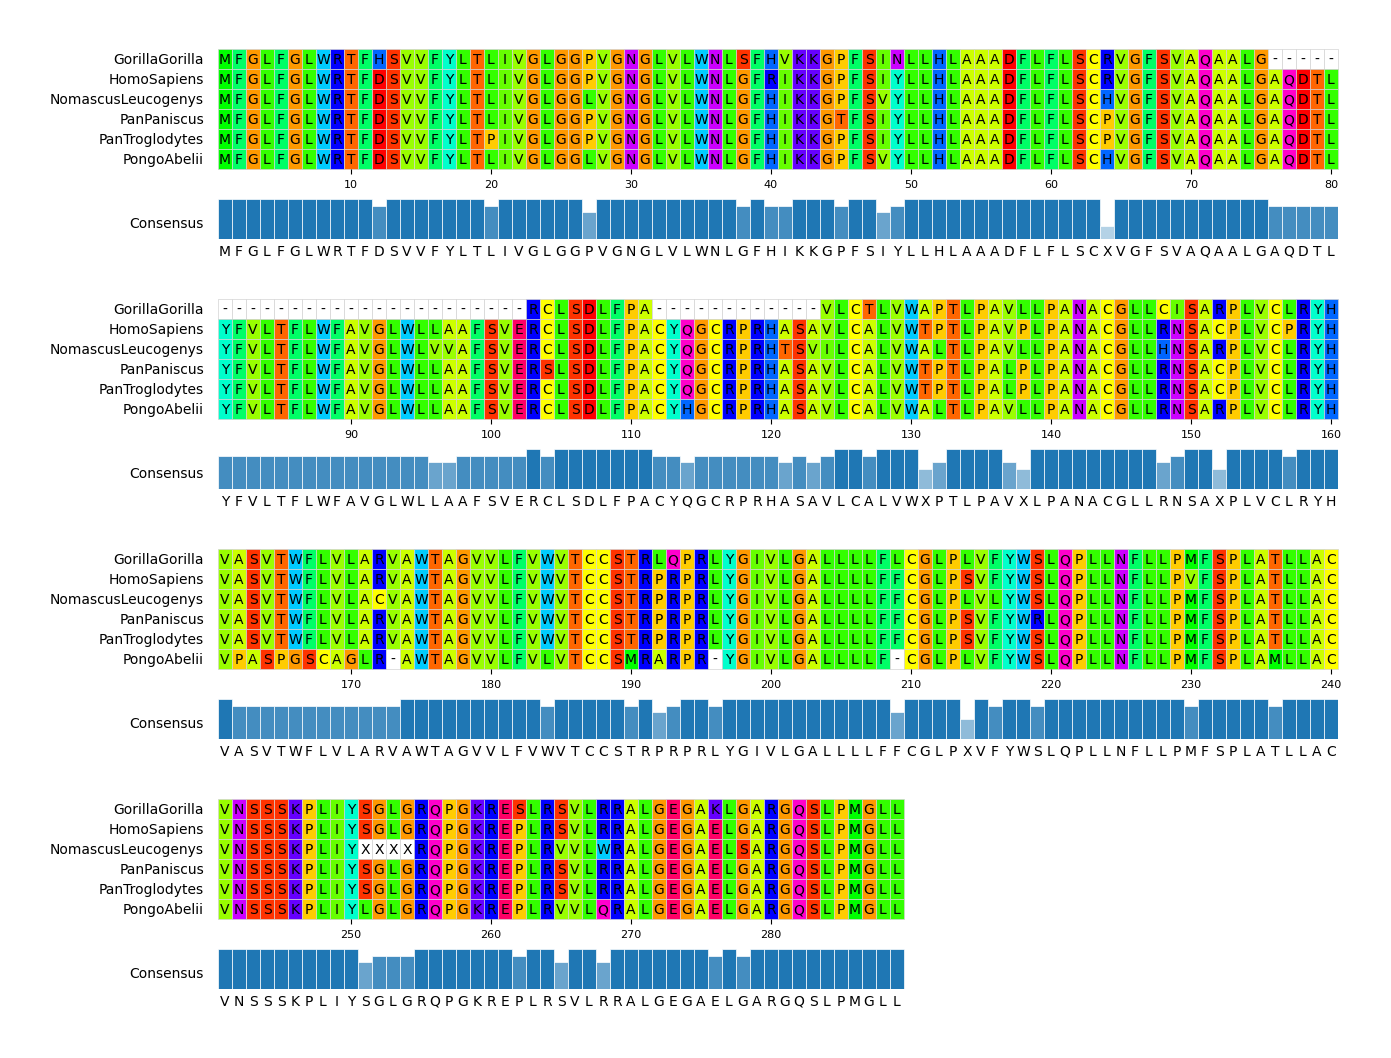
本記事では、MSA(Multiple Sequence Alignment)データを簡単に可視化することを目的として個人開発してみたPythonパッケージ「pyMSAviz」(GitHub / Document)を紹介します。
MSAデータの可視化は、基本的にはJalviewやSeaViewといったGUIツールを使えばいいと思います。ただ、場合によってはAPIやCLIで自動的にMSA可視化図を出力したいときもあります。そういったケースでpyMSAvizを利用することで、可視化範囲やハイライト位置等を柔軟に設定したMSA可視化図をいい感じに出力することができます。
実装機能
MSAデータの基本的な処理にはBiopythonのBio.Alignを活用して、Pythonの標準的な描画パッケージであるmatplotlibをベースにJalviewを参考にした表示スタイル・各種カラースキームでMSAデータを可視化するAPI/CLI機能を実装しています。機能実装する上で、MSAデータ可視化Rパッケージであるggmsaの実装も参考にしました。
pyMSAvizでは、主に以下のようなMSA可視化機能を実装しています。
- MSAの可視化範囲の指定
- 任意のMSA折返し長の指定
- 各種カラースキームでの表示
- コンセンサス配列・保存度バーの表示
- 指定位置・範囲へのハイライトやマーカー、テキストアノテーション表示
インストール方法
pyMSAvizはPyPIとbiocondaにそれぞれパッケージを登録しているので、pipまたはcondaコマンドでインストール可能です。
PyPIパッケージ
pip install pymsaviz
Biocondaパッケージ
conda install -c conda-forge -c bioconda pymsaviz
API実行例
pyMSAvizのAPI実行例の一部をここに記載します。より詳細なAPI実行例に興味があれば、Getting StartedやAPI Docsの各種ドキュメントを参照してください。
API Example1
from pymsaviz import MsaViz, get_msa_testdata

msa_file = get_msa_testdata("HIGD2A.fa")
mv = MsaViz(msa_file, wrap_length=60, show_count=True)
mv.savefig("api_example01.png")
API Example2
from pymsaviz import MsaViz, get_msa_testdata

msa_file = get_msa_testdata("MRGPRG.fa")
mv = MsaViz(msa_file, color_scheme="Taylor", wrap_length=80, show_grid=True, show_consensus=True)
mv.savefig("api_example02.png")
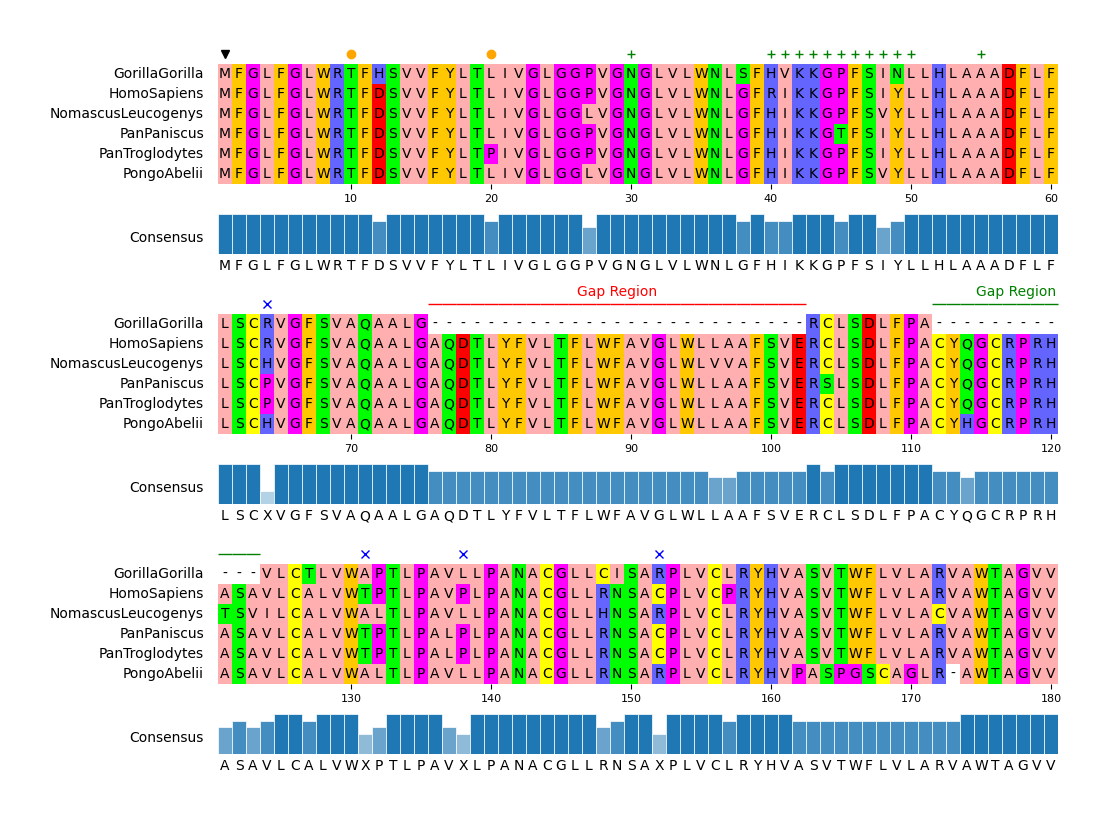
API Example3
from pymsaviz import MsaViz, get_msa_testdata

msa_file = get_msa_testdata("MRGPRG.fa")
mv = MsaViz(msa_file, end=180, wrap_length=60, show_consensus=True)

# Extract MSA positions less than 50% consensus identity
pos_ident_less_than_50 = []
ident_list = mv._get_consensus_identity_list()
for pos, ident in enumerate(ident_list, 1):
    if ident <= 50:
        pos_ident_less_than_50.append(pos)

# Add markers
mv.add_markers([1])
mv.add_markers([10, 20], color="orange", marker="o")
mv.add_markers([30, (40, 50), 55], color="green", marker="+")
mv.add_markers(pos_ident_less_than_50, marker="x", color="blue")
# Add text annotations
mv.add_text_annotation((76, 102), "Gap Region", text_color="red", range_color="red")
mv.add_text_annotation((112, 123), "Gap Region", text_color="green", range_color="green")

mv.savefig("api_example03.png")
CLI実行例
簡単にコマンドからMSAデータ可視化をするためにpyMSAvizではCLIも実装しています。CLIのMSAデータ可視化の機能性・柔軟性は、APIと比較すると低くなります。
実行例で利用しているテストデータはこちらからダウンロードできます。
CLIオプション設定
$ pymsaviz -h
usage: pymsaviz [-i I] -o O [--format] [--color_scheme] [--start] [--end] [--wrap_length]
                [--wrap_space_size] [--show_grid] [--show_count] [--show_consensus] [--consensus_color]
                [--consensus_size] [--sort] [--dpi] [-v] [-h]

MSA(Multiple Sequence Alignment) visualization CLI tool

optional arguments:
-i I, --infile I    Input MSA file
-o O, --outfile O   Output MSA visualization file (*.png|*.jpg|*.svg|*.pdf)
--format            MSA file format (Default: 'fasta')
--color_scheme      Color scheme (Default: 'Zappo')
--start             Start position of MSA visualization (Default: 1)
--end               End position of MSA visualization (Default: 'MSA Length')
--wrap_length       Wrap length (Default: None)
--wrap_space_size   Space size between wrap MSA plot area (Default: 3.0)
--show_grid         Show grid (Default: OFF)
--show_count        Show seq char count without gap on right side (Default: OFF)
--show_consensus    Show consensus sequence (Default: OFF)
--consensus_color   Consensus identity bar color (Default: '#1f77b4')
--consensus_size    Consensus identity bar height size (Default: 2.0)
--sort              Sort MSA order by NJ tree constructed from MSA distance matrix (Default: OFF)
--dpi               Figure DPI (Default: 300)
-v, --version       Print version information
-h, --help          Show this help message and exit

Available Color Schemes:
['Clustal', 'Zappo', 'Taylor', 'Flower', 'Blossom', 'Sunset', 'Ocean', 'Hydrophobicity', 'HelixPropensity',
 'StrandPropensity', 'TurnPropensity', 'BuriedIndex', 'Nucleotide', 'Purine/Pyrimidine', 'Identity', 'None']
CLI Example1
pymsaviz -i ./example/HIGD2A.fa -o cli_example01.png --color_scheme Identity
CLI Example2
pymsaviz -i ./example/MRGPRG.fa -o cli_example02.png --wrap_length 80 \
         --color_scheme Taylor --show_consensus --show_count
CLI Example3
pymsaviz -i ./example/MRGPRG.fa -o cli_example03.png --start 100 --end 160 \
         --color_scheme Flower --show_grid --show_consensus --consensus_color tomato
最後に
matplotlibのプロット機能の理解をより深めるために、MSAデータの可視化を題材としてpyMSAvizを開発してみました。記事冒頭に記述した通り、MSAデータの可視化は基本的にはGUIツールを使えばいいと思っているので、あまり需要はないのかなと思っています。もし興味がある方がいれば、触ってみてください。
