はじめに
TensorFlowを試す時間ができたので、いろいろ試してみたいと思っています。
サンプルデータが付属していたり、本家のチュートリアルが非常に充実しているので、本当にすぐ試すことができて凄いですね。
今回は、MNISTのデータを使ってAutoEncoderをやってみようと思います。
AutoEncoderに関する情報は既にたくさんありますが、例えば
http://vaaaaaanquish.hatenablog.com/entry/2013/12/03/033850
の解説はわかりやすいと思います。
今回はAutoEncoderのアルゴリズム的な追求というより、TensorFlowを使い慣れることを目的としているので、あまり細かいことは気にしてないです(活性化関数とかノイズ入れるとか)。
Version
- Mac OS: 10.11.1
- python 2.7.9
- matplotlib==1.5.0
- numpy==1.10.2
- protobuf==3.0.0a3
- six==1.10.0
- tensorflow==0.6.0
概要
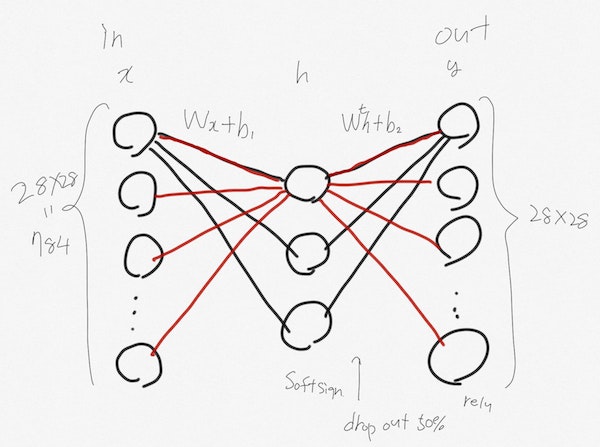
イメージこんな感じです。
結果
入力と出力を視覚的に評価
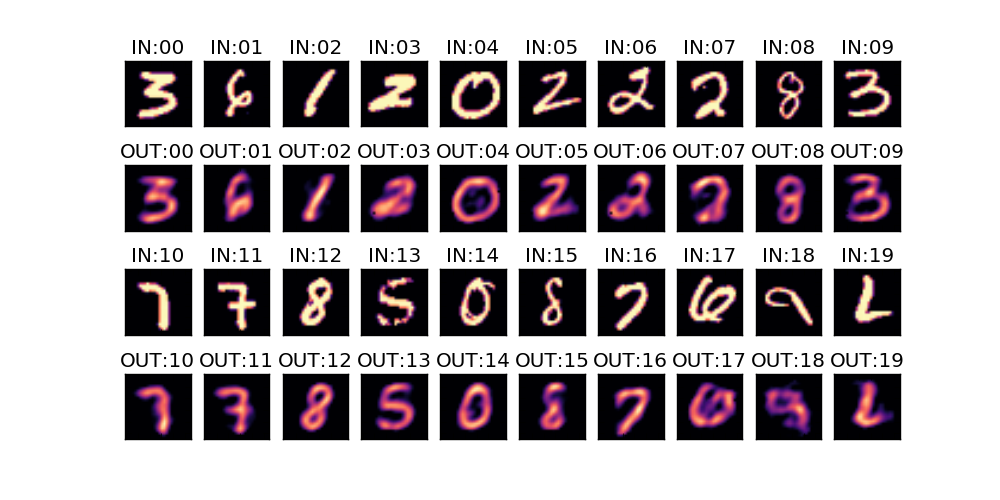
中間層50個程度のときの比較画像です。
このくらいでも、まあまあ再現できているように見えます。
おそらく実装もそこまで間違っていないのだろうと自信が持てます。
※ それにしても IN:19 は数字なのか...? 人間でも学習しないと何を表しているのかわからないw
学習過程
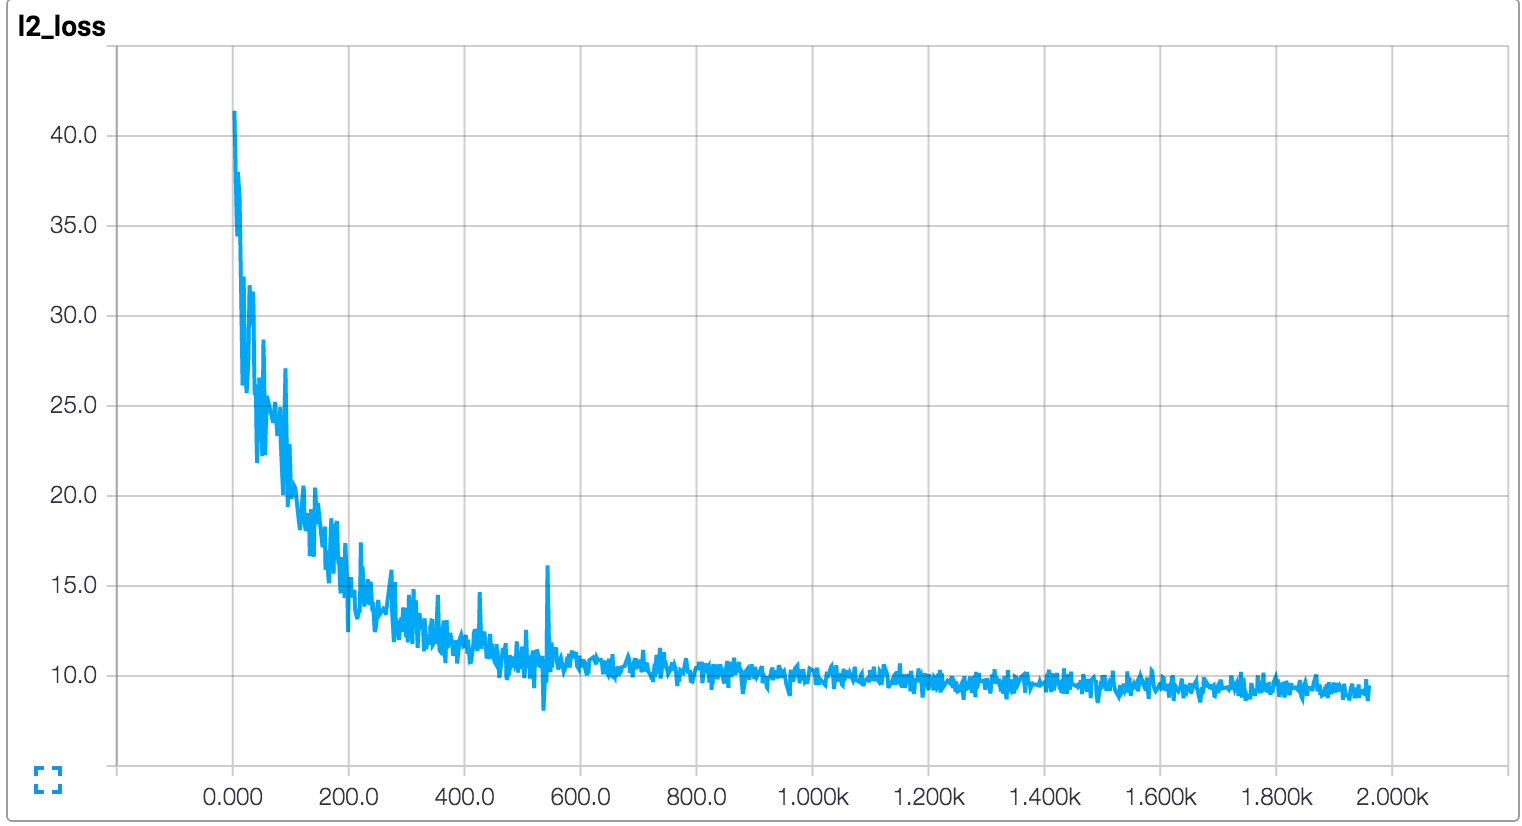
TensorFlowの良い点として、学習過程を TensorBoard という付属ツールでグラフにしてくれる点があります。意外とこういうことに実装労力を払うこともあるので、非常に気が利いてます。
だいたい1000回くらいでいい感じに学習しているようです。
コード
上から下までだーっと処理を並べています。
まあ、最初流れを理解するにはこういうのも悪く無いかと。
このレベルの処理だと本当に最低限のことを書くだけで動いちゃいますね。
※何か間違いとかあるかもしれませんので、ご注意ください。
# !/usr/bin/env python
# coding: utf-8

import tensorflow as tf
from tensorflow.examples.tutorials.mnist import input_data
import matplotlib.pyplot as plt


mnist = input_data.read_data_sets("MNIST_data/", one_hot=True)
H = 50
BATCH_SIZE = 100
DROP_OUT_RATE = 0.5


def weight_variable(shape):
    initial = tf.truncated_normal(shape, stddev=0.1)
    return tf.Variable(initial)


def bias_variable(shape):
    initial = tf.constant(0.1, shape=shape)
    return tf.Variable(initial)


# Input: x : 28*28=784
x = tf.placeholder(tf.float32, [None, 784])

# Variable: W, b1
W = weight_variable((784, H))
b1 = bias_variable([H])

# Hidden Layer: h
# softsign(x) = x / (abs(x)+1); https://www.google.co.jp/search?q=x+%2F+(abs(x)%2B1)
h = tf.nn.softsign(tf.matmul(x, W) + b1)
keep_prob = tf.placeholder("float")
h_drop = tf.nn.dropout(h, keep_prob)

# Variable: b2
W2 = tf.transpose(W)  # 転置
b2 = bias_variable([784])
y = tf.nn.relu(tf.matmul(h_drop, W2) + b2)

# Define Loss Function
loss = tf.nn.l2_loss(y - x) / BATCH_SIZE

# For tensorboard learning monitoring
tf.scalar_summary("l2_loss", loss)

# Use Adam Optimizer
train_step = tf.train.AdamOptimizer().minimize(loss)

# Prepare Session
init = tf.initialize_all_variables()
sess = tf.Session()
sess.run(init)
summary_writer = tf.train.SummaryWriter('summary/l2_loss', graph_def=sess.graph_def)

# Training
for step in range(2000):
    batch_xs, batch_ys = mnist.train.next_batch(BATCH_SIZE)
    sess.run(train_step, feed_dict={x: batch_xs, keep_prob: (1-DROP_OUT_RATE)})
    # Collect Summary
    summary_op = tf.merge_all_summaries()
    summary_str = sess.run(summary_op, feed_dict={x: batch_xs, keep_prob: 1.0})
    summary_writer.add_summary(summary_str, step)
    # Print Progress
    if step % 100 == 0:
        print(loss.eval(session=sess, feed_dict={x: batch_xs, keep_prob: 1.0}))

# Draw Encode/Decode Result
N_COL = 10
N_ROW = 2
plt.figure(figsize=(N_COL, N_ROW*2.5))
batch_xs, _ = mnist.train.next_batch(N_COL*N_ROW)
for row in range(N_ROW):
    for col in range(N_COL):
        i = row*N_COL + col
        data = batch_xs[i:i+1]

        # Draw Input Data(x)
        plt.subplot(2*N_ROW, N_COL, 2*row*N_COL+col+1)
        plt.title('IN:%02d' % i)
        plt.imshow(data.reshape((28, 28)), cmap="magma", clim=(0, 1.0), origin='upper')
        plt.tick_params(labelbottom="off")
        plt.tick_params(labelleft="off")

        # Draw Output Data(y)
        plt.subplot(2*N_ROW, N_COL, 2*row*N_COL + N_COL+col+1)
        plt.title('OUT:%02d' % i)
        y_value = y.eval(session=sess, feed_dict={x: data, keep_prob: 1.0})
        plt.imshow(y_value.reshape((28, 28)), cmap="magma", clim=(0, 1.0), origin='upper')
        plt.tick_params(labelbottom="off")
        plt.tick_params(labelleft="off")

plt.savefig("result.png")
plt.show()
ポイント
y などのVariable の現在の値を取り出すには、 tf.Session が必要になります。例えば、
y_value = y.eval(session=sess, feed_dict={x: data, keep_prob: 1.0})
みたいになります。 イマイチ session.run() と y.eval() の違いがわかってないんですが。まあいいや。
Sessionは計算実行空間みたいなイメージですかね。そこに Graphを割り当てて、値を流し込むという感じなのかな。
注意: matplotlibでエラーがでるんですが
Macでvirtualenvなど使っていると matplotlib が動いてくれなかったりしますが、
http://matplotlib.org/faq/virtualenv_faq.html
で紹介されているように、このFAQの下のほうにあるコードを ~/.pyenv/versions/tf/bin/frameworkpython みたいなVirtualEnvのbinの下において、それを代わりに使うと動くようになります。
さいごに
TensorFlowは感じとしては theano っぽいですね(事前に計算グラフを構築して一気に実行するようなところが)。まあ他のもそういう感じなのかもしれないですが。
そしてtensorflowはpython3にも対応し始めたそうなので、これを機にPython3に移行しようかなぁ。


